
Solar energy is becoming a leading force in the global shift toward clean, renewable power. As the world faces climate change and rising energy demands, more countries are turning to the sun for sustainable solutions. But which nations are leading the way?
This article ranks the Top 20 Countries With the Highest Solar Power Capacity based on installed capacity measured in gigawatts (GW). We explore how these countries achieved their status, what policies drive their success, and what the future holds for global solar energy. Whether you’re an eco-conscious reader, a student of renewable energy, or an investor looking into green technologies, this guide will give you valuable insight into the solar power race.
Global Solar Power Boom: A Quick Overview
The global demand for solar energy has skyrocketed in the last decade. Declining costs of photovoltaic (PV) panels, increased government support, and public awareness about climate change have contributed to this shift.
Key Global Trends:
Organizations like the International Renewable Energy Agency (IRENA) and the International Energy Agency (IEA) regularly publish solar development data, helping nations align their growth strategies.
|
Trend |
Description |
|
Falling Costs |
Solar panels are now over 80% cheaper than they were in 2010 |
|
Policy Push |
Countries offer tax credits, feed-in tariffs, and subsidies |
|
Tech Advancement |
Better storage, tracking systems, and smart grids boost efficiency |
|
Global Goals |
UN SDGs and the Paris Agreement push for clean energy expansion |
How We Ranked the Top 20 Countries
This list is based on the latest solar PV installed capacity data as of 2025, taken from IRENA, IEA, and national energy ministries. Countries are ranked by their total installed solar power capacity (in gigawatts – GW).
Factors considered:
- Total operational solar PV capacity
- Growth rate over the last 5 years
- National policies promoting solar development
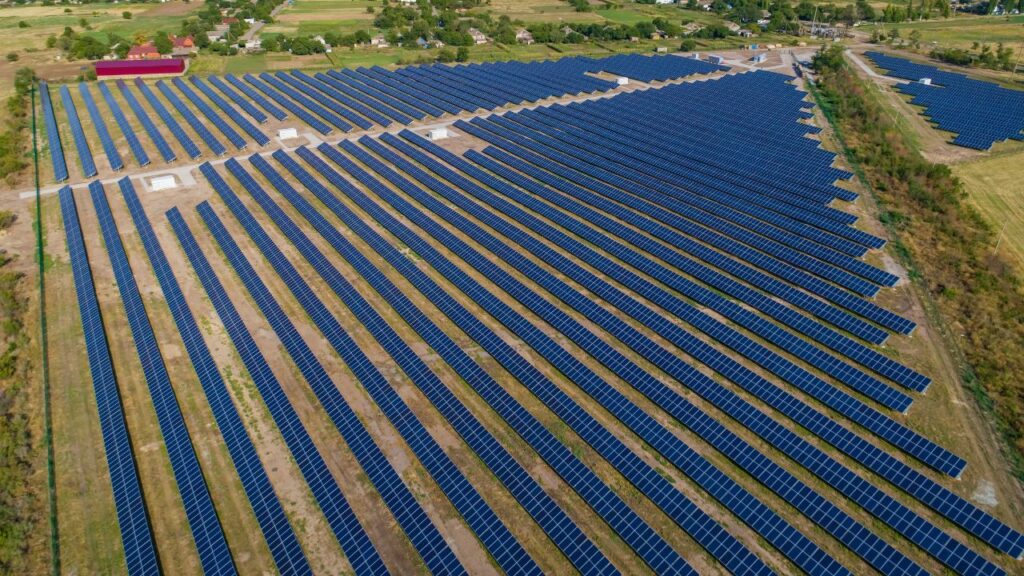
Top 20 Countries Leading the Solar Power Race [2025 Edition]
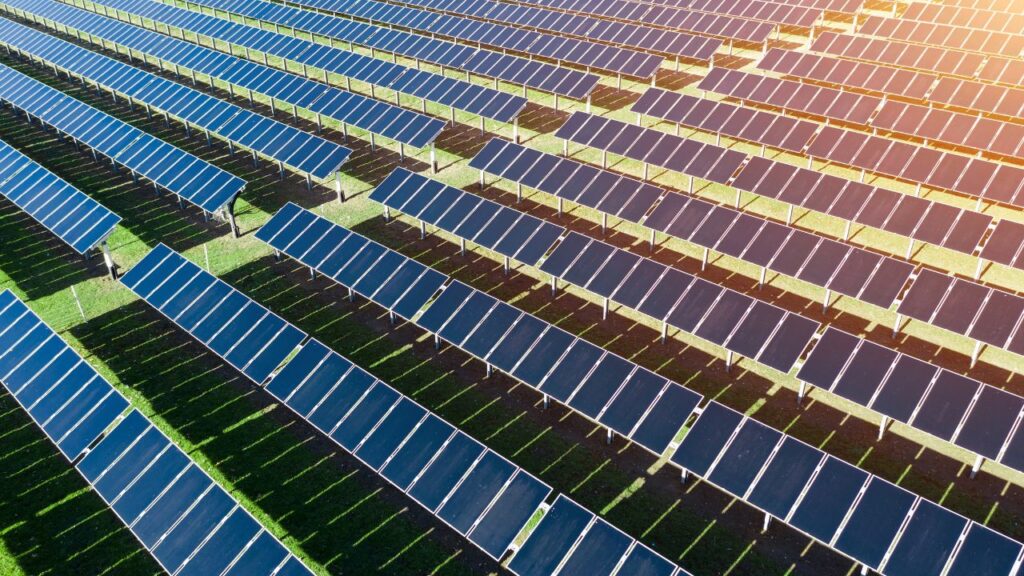
As solar energy continues to reshape the global energy market, these 20 countries have emerged as the frontrunners in solar adoption. From massive solar farms to innovative rooftop solutions, these nations are setting the pace for a cleaner, greener future. Their achievements not only reflect technological progress but also highlight the importance of policy, climate, and investment in renewable energy development.
1. China
China is the undisputed global leader in solar power, with over 500 GW of installed solar capacity. The country has made solar energy a central part of its strategy to reduce carbon emissions and achieve carbon neutrality by 2060.
China’s dominance is supported by strong government support, advanced manufacturing capabilities, and large-scale deployment of both utility and rooftop solar systems. It also leads in solar technology exports globally.
China is the undisputed global leader in solar power, with over 500 GW of installed solar capacity.
China dominates both in installation and manufacturing, producing 70% of the world’s solar panels.
|
Metric |
Value |
|
Installed Capacity |
500+ GW |
|
Key Region |
Tengger Desert Solar Park, Qinghai province |
|
% of Global Solar |
~33% |
|
Major Policy |
Feed-in tariffs, manufacturing subsidies |
2. United States
The U.S. has over 160 GW of solar capacity, largely driven by federal tax incentives and state-level policies. With a diverse energy landscape, solar is now among the fastest-growing energy sources in the country.
The U.S. combines technological innovation, a strong private sector, and consumer incentives to expand solar power. Several states have set ambitious 100% clean energy targets, accelerating adoption further.
The U.S. has over 160 GW of solar capacity, largely driven by federal tax incentives and state-level policies.
The U.S. also invests in solar research and innovation, boosting the grid with smart technologies.
|
Metric |
Value |
|
Installed Capacity |
160+ GW |
|
Top States |
California, Texas, Florida |
|
Growth Drivers |
Inflation Reduction Act, net metering |
|
Major Project |
Topaz Solar Farm, California |
3. India
India has rapidly climbed the ranks with more than 100 GW of solar power. The country views solar energy as key to meeting its growing energy needs and climate goals.
Massive solar parks and competitive auctions have helped India scale solar quickly. Rural electrification and industrial needs are also being met with hybrid solar systems.
India has rapidly climbed the ranks with more than 100 GW of solar power.
India’s success stems from aggressive solar auctions, land availability, and government incentives.
|
Metric |
Value |
|
Installed Capacity |
100+ GW |
|
Largest Park |
Bhadla Solar Park (2.25 GW) |
|
Government Scheme |
National Solar Mission |
|
Solar Target |
280 GW by 2030 |
4. Japan
Despite limited space, Japan has installed around 80 GW of solar power, mostly through rooftop systems. After the Fukushima disaster, Japan prioritized renewables for energy security.
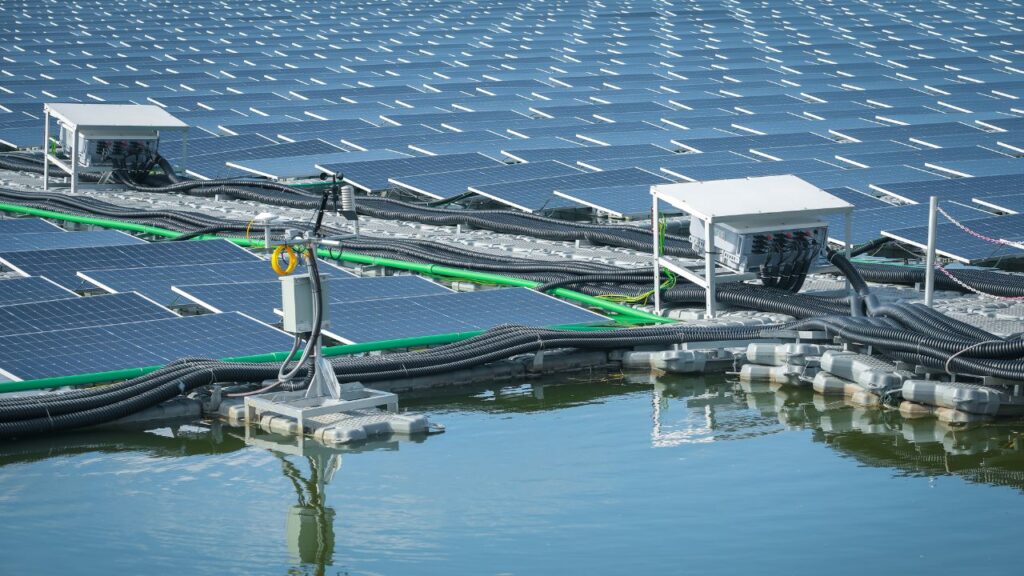
Japan has integrated solar into homes, schools, and offices, using its advanced building codes to encourage green energy development. Floating solar systems are also gaining popularity.
Despite limited space, Japan has installed around 80 GW of solar power, mostly through rooftop systems.
|
Metric |
Value |
|
Installed Capacity |
80 GW |
|
Key Segment |
Residential and commercial rooftops |
|
Government Support |
Feed-in tariffs, building mandates |
|
Limitation |
Land scarcity, aging grid |
5. Germany
Germany, an early adopter of solar technology, has over 70 GW of installed PV capacity. It set a global example with its comprehensive Energiewende energy transition policy.
Germany’s decentralized model empowers homeowners, cooperatives, and small businesses to invest in solar. Despite its less sunny climate, strong support policies make it a solar leader.
Germany, an early adopter, has over 70 GW of solar PV.
|
Metric |
Value |
|
Installed Capacity |
70 GW |
|
Top Feature |
Solar rooftops and community solar |
|
National Goal |
Climate-neutral by 2045 |
|
Unique Approach |
“Energiewende” (energy transition policy) |
6. Australia
Australia’s solar boom has led to 55+ GW of installed capacity. With abundant sunshine and falling panel prices, solar adoption has soared.
Over 30% of households have rooftop systems, making Australia a world leader in per capita installations. However, challenges with grid integration and energy storage still remain.
|
Metric |
Value |
|
Installed Capacity |
55+ GW |
|
Rooftop Penetration |
Highest in the world |
|
Climate Impact |
Strong solar irradiance |
|
Key Challenge |
Grid stability issues |
7. South Korea
South Korea has around 40 GW of solar energy capacity. It aims to reduce reliance on nuclear and coal by boosting renewables.
The government encourages solar installations on schools, public buildings, and urban infrastructure. Floating solar is gaining traction as a space-efficient solution.
|
Metric |
Value |
|
Installed Capacity |
40 GW |
|
Policy Push |
Renewable Portfolio Standards (RPS) |
|
Urban Solar |
Focus on solar in dense areas |
|
Emerging Tech |
Floating solar projects |
8. Spain
Spain has re-emerged as a solar leader with over 38 GW capacity. The country enjoys high solar irradiance, especially in southern regions.
Government incentives and improved grid access have sparked a wave of utility-scale and community solar projects. Spain is also aligning with EU-wide clean energy targets.
|
Metric |
Value |
|
Installed Capacity |
38 GW |
|
Strength |
Utility-scale solar farms |
|
Government Push |
EU Green Deal support |
|
Trend |
Community solar projects |
9. Italy
Italy has embraced solar with more than 32 GW installed. Its Mediterranean climate and dense urban areas make it ideal for rooftop systems.
Generous tax incentives like the Superbonus have spurred installations. The country is also exploring agrivoltaic solutions to combine solar and farming.
|
Metric |
Value |
|
Installed Capacity |
32 GW |
|
Residential Solar |
Strong adoption due to sun exposure |
|
Incentives |
Superbonus scheme, net metering |
|
Challenge |
Permitting delays |
10. Brazil
Brazil’s solar market has surpassed 30 GW, with massive potential. Its vast territory and sunlight abundance offer unmatched opportunities.
Both residential and utility-scale projects are booming, thanks to decentralized energy policies and lower technology costs.
|
Metric |
Value |
|
Installed Capacity |
30+ GW |
|
Rooftop Solar |
Strong growth in remote areas |
|
Key Factor |
Decentralized generation policy |
|
Outlook |
High solar potential near equator |
11. France
France has installed more than 28 GW of solar power. The country is accelerating its clean energy transition under the Multiannual Energy Plan.
France promotes agrivoltaics and dual land use projects to meet solar targets while preserving farmland. This is an opportunity for entrepreneurs who want to open a French business in this field.
|
Metric |
Value |
|
Installed Capacity |
28 GW |
|
Government Goal |
100 GW by 2050 |
|
Priority |
Integrating solar with agriculture (agrivoltaics) |
|
Support |
Feed-in tariffs and tenders |
12. United Kingdom
The UK has over 25 GW of solar power capacity. While it has less sunlight than many peers, policy support has sustained growth.
Small-scale rooftop solar is widespread, and the Smart Export Guarantee encourages grid feed-in. The UK’s net-zero 2050 target also promotes solar adoption.
|
Metric |
Value |
|
Installed Capacity |
25 GW |
|
Popular System |
Rooftop solar in homes and businesses |
|
Challenge |
Less sunlight, seasonal generation |
|
Support |
Smart Export Guarantee (SEG) |
13. Mexico
Mexico has over 22 GW of solar installations. Its geographical location gives it consistent sun exposure throughout the year.
Large-scale projects and residential systems are growing, though policy uncertainty has slowed progress recently.
|
Metric |
Value |
|
Installed Capacity |
22 GW |
|
Key Projects |
Villanueva Solar Park (828 MW) |
|
Geography |
Strong sun coverage year-round |
|
Barrier |
Regulatory hurdles under changing government policies |
14. Netherlands
Netherlands has installed more than 20 GW, mostly from rooftops. High population density and limited land push the adoption of dual-use solar.
Solar panels are commonly placed on warehouses, homes, and even water bodies. The country also leads in solar capacity per capita.
|
Metric |
Value |
|
Installed Capacity |
20+ GW |
|
Unique Practice |
Dual land use (solar + agriculture) |
|
Incentive |
Subsidized residential solar |
|
Density |
High solar density per capita |
15. Vietnam
Vietnam has rapidly expanded to over 18 GW of solar power. Much of this growth occurred in just two years.
Generous feed-in tariffs (now expired) triggered massive installations, especially in the southern region. However, grid congestion remains a concern.
|
Metric |
Value |
|
Installed Capacity |
18+ GW |
|
Surge |
Explosive growth in 2020-2022 |
|
Key Driver |
Generous feed-in tariffs (expired in 2023) |
|
Issue |
Grid congestion challenges |
16. Turkey
Turkey’s solar sector has reached 17 GW and continues growing. The government has created a strong roadmap for renewable energy expansion.
Turkey also encourages domestic solar panel manufacturing, reducing dependency on imports.
|
Metric |
Value |
|
Installed Capacity |
17 GW |
|
Solar Strategy |
National Renewable Energy Action Plan |
|
Investment |
Local manufacturing encouraged |
|
Target |
23 GW by 2030 |
17. South Africa
South Africa has crossed 15 GW, aiming to reduce reliance on coal. Frequent power cuts have made solar a vital part of energy resilience.
Government IPP programs and falling panel prices have attracted international investments.
|
Metric |
Value |
|
Installed Capacity |
15+ GW |
|
Motivation |
Load shedding and energy security |
|
Government Plan |
Renewable Energy IPP Programme (REIPPP) |
|
Strength |
High solar potential due to climate |
18. Chile
Chile has become a South American solar leader with 14 GW. The Atacama Desert offers some of the highest solar radiation in the world.
The country plans to derive 70% of its electricity from renewables by 2030, with solar as a major contributor.
|
Metric |
Value |
|
Installed Capacity |
14 GW |
|
Leading Region |
Atacama Desert |
|
Policy |
Clean Energy Law |
|
Outlook |
70% renewable power target by 2030 |
19. Egypt
Egypt has installed 13 GW of solar capacity. The government has made renewable energy a priority under Egypt Vision 2030.
Large-scale solar farms in desert regions are helping diversify the country’s energy mix.
|
Metric |
Value |
|
Installed Capacity |
13 GW |
|
Notable Project |
Benban Solar Park (1.65 GW) |
|
Vision |
Egypt Vision 2030 Plan |
|
Benefit |
Strong desert sun availability |
20. Belgium
Belgium rounds out the list with 12 GW of solar capacity. The country focuses heavily on rooftop installations.
Despite limited land, Belgium’s green certificate scheme and citizen-driven energy cooperatives drive solar adoption.
|
Metric |
Value |
|
Installed Capacity |
12 GW |
|
Policy |
Green certificate system |
|
Focus |
Rooftop solar adoption |
|
Issue |
Limited land for utility-scale development |
Solar Power Capacity by Country: At-a-Glance Table
|
Rank |
Country |
Installed Capacity (GW) |
Notable Feature |
|
1 |
China |
500+ |
Largest capacity, strong exports |
|
2 |
USA |
160+ |
Federal and state tax incentives |
|
3 |
India |
100+ |
Massive solar parks |
|
4 |
Japan |
80 |
Rooftop dominance |
|
5 |
Germany |
70 |
Energiewende policy |
|
6 |
Australia |
55+ |
High rooftop adoption |
|
7 |
South Korea |
40 |
Floating solar expansion |
|
8 |
Spain |
38 |
Utility-scale growth |
|
9 |
Italy |
32 |
Residential solar |
|
10 |
Brazil |
30+ |
Equator location advantage |
|
11 |
France |
28 |
Agrivoltaics projects |
|
12 |
UK |
25 |
Rooftop growth |
|
13 |
Mexico |
22 |
Villanueva Solar Park |
|
14 |
Netherlands |
20+ |
Dual land-use approach |
|
15 |
Vietnam |
18+ |
Fast policy-driven growth |
|
16 |
Turkey |
17 |
National strategy |
|
17 |
South Africa |
15+ |
Energy crisis response |
|
18 |
Chile |
14 |
Atacama solar dominance |
|
19 |
Egypt |
13 |
Benban Solar Park |
|
20 |
Belgium |
12 |
High rooftop density |
What We Can Learn From Solar Leaders
Government Support Is Crucial
Most solar success stories involve strong policies, such as tax incentives, feed-in tariffs, or auction-based systems.
Innovation Accelerates Growth
From floating solar to agrivoltaics, countries that invest in new solar tech lead the pack.
Geography Still Matters
Sun-rich nations have a natural edge, but even cloudy countries thrive with the right incentives and technology.
Future Outlook of Global Solar Energy Capacity
- The IEA predicts global solar capacity could triple by 2030, reaching over 6,000 GW.
- New players like Morocco, Saudi Arabia, and the Philippines are entering the top solar market.
- Innovations like solar hydrogen, vertical solar, and perovskite cells may further reduce costs and land use.
Takeaways
The global shift toward solar energy is accelerating. Countries with smart policies, innovation, and a commitment to sustainability are leading the solar revolution. Whether you’re looking to invest, support clean energy, or simply stay informed, tracking the countries with the highest solar power capacity gives valuable insight into the future of energy.
FAQs
What is solar power capacity?
The total electricity a country can generate from solar panels, measured in gigawatts (GW).
How is solar capacity measured?
By the maximum output of all solar installations, both rooftop and utility-scale.
Which country uses the most solar energy?
China generates and consumes the most solar energy overall.
Is solar capacity the same as solar energy generation?
No. Capacity is potential output; generation is actual energy produced over time.
Can a country run 100% on solar power?
While not yet common, it’s technically possible with storage and grid support.


