

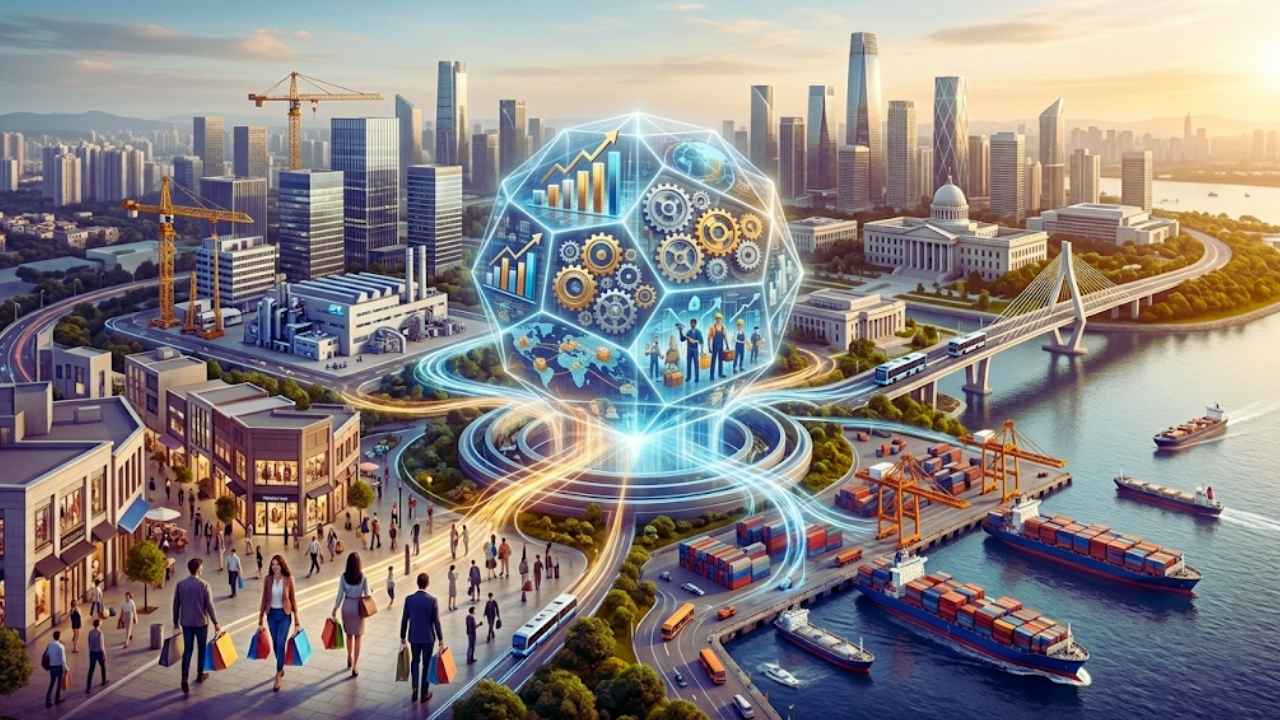
You hear politicians and financial reporters throw this acronym around every single night on the evening news. They use it as a giant scoreboard to declare whether our country is winning or losing the economic race. But despite how often this term flashes across your screen, very few people actually understand how it works in plain English. We are going to strip away the confusing jargon and show you exactly how this massive economic indicator impacts your daily life.
If you have ever caught yourself asking what is GDP while watching the financial networks, you are definitely not alone. It stands for Gross Domestic Product, and it represents the absolute bedrock of modern macroeconomics. Think of it as a comprehensive report card that tracks the financial performance of an entire nation over a specific period. When the number goes up, the country is generating more wealth, businesses are expanding, and people are generally feeling optimistic about their financial futures. When the number goes down, it signals that the engine of the economy is sputtering, which usually leads to a wave of financial anxiety.
We live in a deeply interconnected world where macroeconomic trends eventually trickle down to your personal bank account. You do not need an advanced degree in finance to understand how these massive monetary shifts work. By learning the basic mechanics of economic progress, you can start making much smarter decisions about your own career and investments. Throughout this guide, we will break down the official formulas, explore the hidden blind spots in the data, and reveal exactly why this famous metric holds so much power over your wallet.
|
Aspect |
Detail |
|
Core Purpose |
Measures the total economic health of a nation |
|
Primary Users |
Government agencies, investors, and central banks |
|
Real World Impact |
Influences job markets and personal interest rates |
|
Primary Question |
Answers how much a country produces in a year |
What Is GDP Exactly? (Defining the Concept)?
When you dig past the complicated academic textbooks, the core concept of this economic indicator is remarkably straightforward. Economists rely on this single metric to evaluate whether a nation is actually thriving or quietly struggling behind the scenes. It serves as a massive receipt for the overall health of an entire country over a specific period. We are going to break down the official definition and look at the different variations that financial experts use to measure real progress. To fully answer what is GDP, we have to look at its strict economic definition.
It is the total market value of all the finished goods and services produced within the physical borders of a country during a specific time frame. Imagine if you could magically track every single financial transaction that happened in the United States over the course of twelve months. You would add up every cup of coffee poured, every software subscription purchased, every medical surgery performed, and every car manufactured. The final number at the very bottom of that impossibly long receipt is the Gross Domestic Product.
It is incredibly important to pay attention to the word finished in that definition. National statistical agencies intentionally only count final products to avoid double counting the same materials. For example, when a baker buys wholesale flour to bake a cake, the purchase of that raw flour is not counted directly in the national tally. Only the final cake sold to the customer is counted because the cost of the flour is already baked into the retail price of the cake. Additionally, the production must happen within the physical borders of the country. A Japanese car manufactured in an Ohio factory counts toward the American total, while an American smartphone assembled in China does not.
|
Measurement Type |
What It Actually Tells Us |
|
Nominal Value |
The raw output measured in current market prices |
|
Real Value |
The output adjusted for inflation over time |
|
Per Capita |
The total output divided by the population |
|
Gross National Product |
The output of residents regardless of location |
The Core Meaning of GDP
Gross Domestic Product captures the economic activity of a nation within a specific timeframe, usually a quarter or a year. It serves as an aggregate measure of production, equal to the sum of the gross value added of all resident institutional units engaged in production. This includes all market production as well as some non-market government and non-profit production services. By centralizing this data into a single monetary metric, policymakers can assess the relative scale of an economy.
Real GDP vs. Nominal GDP
As you start reading financial news, you will quickly notice that economists track two very different versions of this metric. Nominal GDP simply measures the economic output using current market prices. However, this creates a massive problem because it completely ignores the shifting value of money over time. If a country produced one million identical bicycles last year at one hundred dollars each, the total output would be one hundred million dollars. If they produced the exact same one million bicycles this year, but inflation drove the price up to two hundred dollars each, the nominal figure would magically double.
Looking only at the nominal number, you might falsely believe the economy doubled in size, when in reality, everything just got twice as expensive. Real GDP completely solves this illusion by adjusting the data for inflation. Economists hold prices constant based on a designated base year, which allows them to strip away the distortion of rising prices. By doing this, they can look strictly at the actual volume of goods and services being produced. Whenever you hear financial experts debating whether the economy is expanding or shrinking, they are always referring to the real, inflation adjusted numbers.
GDP per Capita
While the national total tells us how massive the entire economic pie is, it does not tell us how big a slice the average person actually gets. That is exactly where the per capita measurement becomes useful. To calculate this specific number, you simply take the total economic output of a country and divide it by the total population. This specific metric is incredibly useful for comparing the standard of living between completely different countries.
A massive country like India has a very large total economic output simply because it has over a billion people working and consuming every day. However, a much smaller country like Switzerland has a significantly higher per capita output. This means the average Swiss citizen generates and consumes vastly more economic value than the average Indian citizen. When you want to figure out the relative prosperity and purchasing power of the average person living in a specific place, the per capita figure gives you the most accurate picture.
Gross National Product (GNP) vs. GDP
You might also hear economists mention the Gross National Product when discussing international trade. While the standard domestic metric measures the value of everything produced within the physical borders of a country, GNP measures the economic output of all the residents of a country, regardless of where they are currently located in the world. If an American citizen owns a factory operating in Mexico, the profits from that factory count toward the American GNP, but they count toward the Mexican domestic product.
Decades ago, GNP was the primary economic indicator used by the government. However, as global trade expanded and massive multinational corporations began operating across dozens of different borders, economists shifted to the domestic model because it provides a much more accurate reflection of the actual labor market and economic health within a specific country.
How Is GDP Calculated? (The Formula)
Figuring out the entire economic output of a massive country like the United States is an absolute logistical nightmare. The Bureau of Economic Analysis and other national statistical agencies must gather millions of data points from corporate surveys and tax records. They actually use three completely different mathematical approaches to ensure their final number is accurate. Let us explore how these three calculation methods work in the real world to capture every single dollar.
The expenditure approach is by far the most common and heavily discussed method used by financial analysts. This specific strategy calculates the total amount of money spent by all the different groups that actively participate in the economy. The fundamental logic here is quite simple, if someone produces a good or a service, someone else has to eventually buy it. Therefore, if we can successfully add up all the spending, we can figure out the total value of the national production.
The formula for the expenditure approach is expressed using a very famous mathematical equation: GDP equals C plus I plus G plus the result of X minus M. In this equation, the C stands for consumer spending, the I stands for business investments, the G stands for government purchases, and the X minus M represents the net value of foreign trade. Every single time you hear a news anchor discussing what is GDP, they are almost certainly looking at the economy through the lens of this exact expenditure formula.
|
Calculation Method |
Primary Focus |
|
Expenditure Approach |
Tracks all the money spent on final goods |
|
Income Approach |
Adds up all the wages and business profits |
|
Production Approach |
Measures the value added at each supply chain step |
The Expenditure Approach
The expenditure framework aggregates total national spending across specific macroeconomic segments. By tracking consumption, capital formation, government allocation, and net trade flows, it establishes a reliable baseline for overall domestic product. This framework assumes that every item produced will eventually be purchased by a domestic consumer, a business investor, the public sector, or an international buyer.
The Income Approach
Instead of tracking what people spend, the income approach calculates the economy by looking at what people earn. The philosophy behind this alternative method is that every single dollar spent on a good or service eventually becomes income for someone else down the line. When you buy an expensive cup of coffee at a local cafe, your spending instantly becomes wages for the barista, operating profit for the cafe owner, and rental income for the commercial landlord who owns the building.
This approach calculates the national total by adding up all the wages and salaries paid to employees, all the corporate profits earned by businesses, all the interest earned on capital investments, and all the rental income generated by physical properties. The statisticians also have to factor in corporate taxes and the depreciation of business assets. While it is significantly more complicated to track than simple spending, the income approach provides a fascinating look at exactly how the wealth generated by the economy is distributed among the working population.
The Production Approach
The production approach, which is sometimes referred to as the value-added approach, looks at the economy purely from the perspective of the creators. Instead of measuring the final retail sale price of a product, this method meticulously calculates the gross value added at every single stage of the complicated production process. Imagine the long journey of creating a simple denim jacket. A farmer grows the raw cotton and sells it to a textile mill.
The mill processes the cotton into denim fabric and sells it to a massive clothing manufacturer. The manufacturer cuts and sews the physical jacket and sells it to a retail store. Finally, the retail store sells the jacket to you at the mall. The production approach calculates the exact financial value added at each of those individual steps, while carefully subtracting the cost of the intermediate inputs used along the way. This specific method is highly effective for identifying exactly which industries are driving the most growth within a country.
The Four Main Components of GDP
Since the expenditure approach is the most widely recognized way to measure economic health, we need to analyze its specific ingredients. Every single dollar spent in a national economy falls into one of four distinct categories. Understanding these four pillars is essential for any savvy investor or citizen who wants to grasp how money flows through the system. We will explore each specific component below to show you exactly what drives national growth. Consumer spending is the absolute undisputed powerhouse of the modern economy.
In the United States, this single massive category accounts for roughly seventy percent of the total economic output. This represents all the hard earned money that everyday people spend on final goods and services just to live their normal lives. This category covers an enormous spectrum of daily purchases. It includes durable goods, which are expensive items meant to last a very long time, like cars, washing machines, and living room furniture. It includes non-durable goods, which are items consumed very quickly, like weekly groceries, clothing, and gasoline.
Finally, it includes services, which represent the largest and fastest growing segment of the economy, encompassing everything from doctor visits and monthly rent payments to streaming subscriptions and restaurant meals. Because consumer spending makes up such a gigantic slice of the economic pie, economists watch consumer confidence surveys like hawks. If everyday people feel secure in their jobs, they open their wallets and spend money freely. If they feel fearful about the future, they hoard their cash, which can bring the entire national economy to a grinding halt.
|
Economic Component |
Examples of Activity |
|
Consumer Spending |
Buying groceries, paying rent, getting a haircut |
|
Business Investment |
Building factories, buying software, stocking inventory |
|
Government Spending |
Funding public schools, building highways, defense |
|
Net Exports |
Selling goods overseas minus buying foreign goods |
Consumer Spending
Household consumption forms the bedrock of total economic expenditure. Changes in consumer sentiment directly dictate production levels across both manufacturing and service-based industries. When employment numbers remain stable, household expenditure increases, injecting liquidity into the commercial market and sustaining the broader economic momentum.
Business Investment
Business investment represents the crucial money that companies spend to maintain or expand their daily operations. Do not confuse this with individuals buying stocks or bonds on a trading app, this metric is strictly about tangible, physical investments in the future infrastructure of a real business. This specific category includes the heavy construction of new manufacturing factories, corporate office buildings, and massive distribution warehouses. It includes the purchase of heavy industrial machinery, specialized medical equipment, and customized computer software used to speed up production.
It also includes changes in corporate inventory. If a car manufacturer builds ten thousand trucks this year but only sells nine thousand of them, the remaining one thousand trucks are formally counted as an inventory investment because they hold real financial value that will eventually be sold in the future. High levels of business investment are always a fantastic sign for the future, as it proves that corporate leaders are optimistic and are actively expanding their capital stock.
Government Spending
Government spending includes all the massive amounts of money spent by federal, state, and local municipalities on final goods and services. This is a gigantic driver of economic activity that directly impacts the quality of your public life. This broad category covers the salaries of millions of public employees, including public school teachers, local police officers, and active military personnel. It covers massive infrastructure projects like paving new highways, repairing aging bridges, and expanding international airports. It also covers the purchase of advanced military defense equipment and the funding of cutting edge public research.
However, it is very important to note that government transfer payments, such as social security checks or unemployment benefits, are never counted in this category. Those specific payments are simply transferring existing money from one group of citizens to another without directly producing a brand new good or service. That government money only enters the economic calculation when the person receiving the benefit actually spends it on their own groceries or rent.
Net Exports
The final piece of the macroeconomic puzzle represents a country’s financial relationship with the rest of the world. Net exports are calculated by taking the total financial value of everything a country sells to other nations and subtracting the total value of everything a country buys from other nations. If a country manages to export more goods than it imports, it has a trade surplus, which directly adds to the national total.
If a country imports more goods than it exports, it has a trade deficit, which actually subtracts from the national total. The United States has famously run a massive trade deficit for several decades, meaning it imports significantly more cheap goods from overseas manufacturers than it actually sells abroad. Despite this constant mathematical drag on the formula, the sheer overwhelming size of American consumer spending easily keeps the overall economic number growing year after year.
Why Should You Care About GDP?
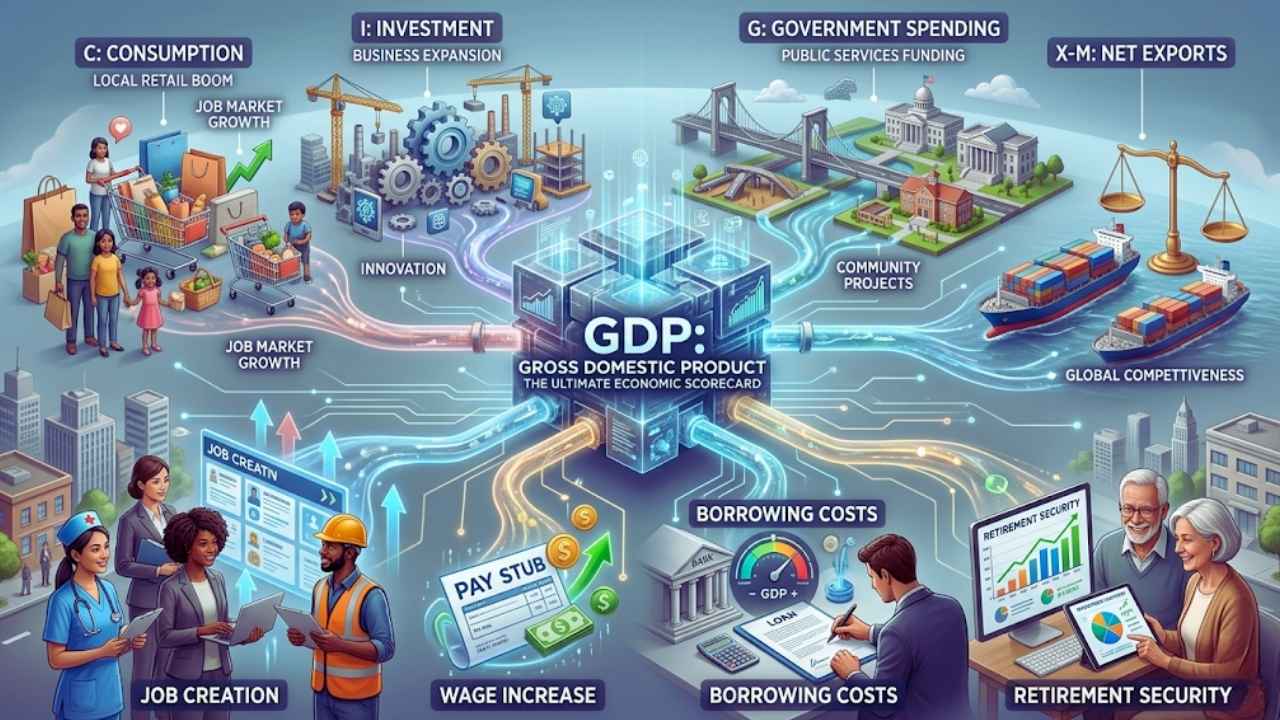
You might think that macroeconomic statistics only matter to Wall Street bankers and politicians in Washington. The reality is that the trajectory of this economic metric directly influences your daily life and personal finances in a major way. It dictates the availability of jobs in your town and determines the interest rates you pay on your credit cards. Here is exactly how national economic progress changes your everyday reality.
The absolute most direct way this massive metric impacts you is through the local labor market. There is a deeply ingrained, undeniable relationship between national economic output and employment opportunities. When the economy is growing, businesses are selling more products and services. To meet this rising consumer demand, they are forced to hire more workers. This leads to abundant job opportunities, drastically lower unemployment rates, and much higher starting salaries as desperate companies compete to attract top talent.
Conversely, when the economy inevitably shrinks, the exact opposite happens. Businesses see a sudden drop in demand for their products. To survive the downturn, they have to aggressively cut costs, which usually means freezing all new hires, halting yearly promotions, and eventually laying off their existing staff. If you are currently looking for a new job, hoping for a raise, or simply wanting to feel secure in your current position, you desperately want to see strong, consistent economic growth in the national reports.
|
Personal Finance Area |
How It Is Impacted |
|
Employment |
High output creates jobs and drives up starting salaries |
|
Borrowing Money |
Fast growth leads central banks to raise interest rates |
|
Retirement Accounts |
Expanding economies boost corporate stock prices |
|
Public Services |
Strong output generates tax revenue for local projects |
How GDP Affects Your Job and Salary?
The trajectory of the business cycle correlates tightly with workforce dynamics and corporate human resource budgets. Periods of sustained economic output provide companies with the financial safety margin necessary to increase internal compensation scales. When the domestic product reaches healthy growth marks, employees gain significant leverage to negotiate better wages or transition to higher-paying opportunities.
The Impact on Interest Rates and Loans
The rapid pace of economic growth heavily influences the critical decisions made by central banks, such as the Federal Reserve in the United States. Central banks have a massive dual mandate: they must keep unemployment low while simultaneously keeping dangerous inflation under strict control. They use monetary policy and interest rates as their primary tools to achieve these complex goals. If the national economy is growing entirely too fast, consumer demand can easily outpace the physical supply of goods. This leads to high inflation where the cost of living skyrockets out of control.
To aggressively cool things down, the central bank will step in and raise interest rates. This makes borrowing money significantly more expensive for everyone. If you are trying to buy a new house, finance a car, or carry a balance on a credit card, a booming economy can paradoxically make your life much more expensive due to these elevated interest rates. On the flip side, if the economy is struggling, central banks will slash interest rates to encourage borrowing, which can be the absolute perfect time for a savvy buyer to lock in a cheap mortgage.
Influence on Stock Markets and Investments
If you actively contribute to a retirement account, a corporate pension plan, or a personal investment portfolio, your net worth is directly tied to the national economic output. The stock market is essentially a forward looking reflection of corporate earnings. When the broader economy is rapidly expanding, consumers are spending money freely, which means corporate revenues are rising across the board. Higher revenues lead to higher profit margins, and those higher profits drive stock prices upward.
Institutional investors closely watch the quarterly economic reports. A report showing stronger than expected growth can send the stock market rallying, instantly increasing the paper value of your retirement savings. However, a report showing a sudden unexpected contraction can trigger a massive panic sell off, completely wiping out months or even years of your hard earned investment gains. Understanding what is GDP and how it trends can help you make rational, long term decisions rather than panicking when you see red numbers on your portfolio dashboard.
Government Policy and Public Services
The overall sheer size of the economy directly dictates how much tax revenue the government can comfortably collect without having to raise individual tax rates. A thriving, expanding economy means more people are working and paying income taxes, and more people are shopping and paying sales taxes. This massive influx of natural revenue allows the government to easily fund public services.
When economic growth suddenly stalls, those tax revenues plummet. To quickly balance the budget, the local government is forced to make incredibly difficult choices. They may have to quietly cut funding for public schools, delay necessary infrastructure repairs on your local roads, reduce the operating hours of public parks, or lay off municipal workers. Alternatively, they may be forced to raise your property taxes to cover the massive shortfall. The daily quality of the public services you rely on is directly tethered to the health of the national economy.
The Limitations of GDP
While it remains the absolute gold standard for measuring economic health, this famous metric is actually far from flawless. Modern economists and sociologists have pointed out massive blind spots in how we currently calculate national success. The formula heavily focuses on production volume while completely ignoring human well-being and long term environmental sustainability.
Let us take a close look at what this famous calculation intentionally leaves out of the final tally. The absolute most glaring limitation of this entire measurement is that it completely ignores the massive value of unpaid labor. If you hire a professional cleaning service to scrub your house, a landscaping company to mow your lawn, and a private chef to cook your meals, all of that paid economic activity is officially recorded and adds to the national total.
However, if you spend your own entire weekend cleaning, mowing, and cooking for your family, none of that grueling labor is counted, even though the exact same services were performed. This fundamentally means the vital, exhausting work of stay at home parents and family caregivers is entirely invisible to the official economic statistics.
|
Blind Spot |
Why It Matters |
|
Unpaid Domestic Labor |
Caregiving and household work are completely ignored |
|
Environmental Damage |
Rebuilding after disasters artificially boosts numbers |
|
Income Inequality |
Massive wealth at the top hides working class struggles |
|
Underground Markets |
Cash transactions and informal jobs slip past the data |
What GDP Leaves Out?
Macroeconomic accounts prioritize measurable cash flows over non-market transactions, creating a skewed baseline of real productivity. By excluding community volunteer services, subsistence farming, and independent domestic maintenance, the national metric fails to represent the true volume of structural work occurring daily. This systematic exclusion underrepresents the critical contribution of informal networks to social stability.
The Difference Between GDP and Quality of Life
Perhaps the most important thing to remember when reading financial news is that a high economic output does not automatically equate to a high quality of life for the actual citizens. The mathematical formula strictly measures quantity, it completely ignores quality. For example, if a massive category five hurricane destroys a coastal city, the subsequent desperate rebuilding effort will require billions of dollars in construction, raw materials, and emergency labor. All of this forced spending will cause the national economic output to skyrocket. The official statistics will show a booming economy, even though the people living in that city are suffering through an absolute disaster.
Similarly, if a country has terrible industrial pollution problems, the money spent on healthcare to treat asthma and the billions spent on environmental cleanup will actually boost the economic numbers. Furthermore, the overall national number tells us absolutely nothing about income inequality. A country could experience massive economic growth, but if all of that new wealth is captured exclusively by the top one percent of the population while the working class stagnates, the average citizen will not feel the benefits of that growth at all. Relying solely on this metric can create a highly distorted view of true human well-being.
GDP Growth Rates and Economic Cycles
The global economy never moves upward in a perfectly straight line no matter what politicians promise. It naturally breathes in and out through a volatile process known as the business cycle. Tracking these historical patterns helps financial experts predict exactly where the market is heading next. We will break down the distinct phases of these cycles and explain what they mean for your personal wallet. An expansion is the absolute golden era of the economic cycle.
During this optimistic phase, the growth rate is consistently positive quarter after quarter. Consumer confidence is soaring, businesses are borrowing cheap money to build new facilities, and jobs are incredibly plentiful. This is the exact phase when wages tend to rise and the stock market generally trends aggressively upward. Eventually, the massive expansion hits an invisible ceiling, known as the peak.
At this specific point, the economy is running as hot as it possibly can. Almost everyone who wants a job has one, and factories are running at absolute maximum capacity. However, this is also when dangerous inflation usually rears its head, as consumer demand completely outpaces the physical limits of corporate supply. Prices get far too high, central banks step in to raise interest rates, and the forward momentum finally begins to slow down.
|
Cycle Phase |
Typical Economic Conditions |
|
Expansion |
High consumer confidence and abundant job openings |
|
Peak |
Maximum capacity often accompanied by rising inflation |
|
Contraction |
Slowing sales and businesses cutting back on investments |
|
Recession |
Two quarters of negative growth with rising unemployment |
Expansion and Peak
The cyclical nature of corporate commerce results in clear intervals of operational efficiency and subsequent market fatigue. During an expansion, access to commercial credit matches the operational needs of growing corporate entities. Once structural resources hit total utilization boundaries at the peak, cost overruns force a deceleration across interconnected market channels.
Contraction and Recessions
Following the dizzying peak, the economy enters a painful contraction phase. The growth rate slows down, and eventually, the numbers turn entirely negative. Consumers, feeling the severe pinch of high prices and high interest rates, start spending significantly less money. Businesses immediately notice the drop in retail sales and respond by cutting back on their investments and laying off their workers. If the inflation adjusted output shrinks for two consecutive quarters, the economy has officially entered a recession.
The National Bureau of Economic Research is the official agency that formally declares when a recession begins and ends. Recessions are incredibly painful periods characterized by high unemployment, stagnant wages, and struggling stock markets. Eventually, prices drop low enough, and interest rates are cut deeply enough, that consumers and businesses slowly begin spending again. The economy hits the absolute bottom of the cycle, known as the trough, and the expansion phase begins all over again.
Final Thoughts
Gross Domestic Product is definitely an imperfect and sometimes frustrating metric that fails to capture the entire human experience. Yet despite all of its obvious flaws, it remains the single most powerful tool we have for taking the temperature of the global economy. By understanding what drives this number upward and what pulls it downward, you gain a massive advantage over the average citizen. You are no longer just a passive participant in the system, but a savvy observer who can anticipate changes and protect your financial future. We have covered a massive amount of ground today.
We explored the core formulas, analyzed the four distinct pillars of consumer and government spending, and revealed exactly how these massive numbers impact your personal interest rates and stock investments. Now that you fully understand what is GDP and how it truly operates, you can watch the evening financial news with complete confidence. You know exactly what the anchors are talking about, and more importantly, you know exactly how to use that information to make smarter, more secure financial decisions for your own life.
Frequently Asked Questions (FAQs) About What is GDP
What is a good GDP growth rate?
Optimal structural growth minimizes macro shocks while accelerating domestic hiring trends. Developed markets target a band that maintains employment stability without triggering hyperinflationary demand-side pressures. If expansion metrics deviate too far above or below this target zone, monetary interventions become necessary to restore systemic baseline balance.
How often is GDP reported?
In the United States, the Bureau of Economic Analysis releases the official data on a quarterly basis. However, because compiling this massive amount of data is so incredibly complex, they actually release three completely different versions for each quarter. The advance estimate comes out just a few weeks after the quarter ends. A month later, they release a preliminary estimate with more accurate data. Finally, a month after that, they release the final estimate. Financial markets can react wildly to the very first advance estimate, even though the numbers are frequently revised later on.
Can GDP trends predict a recession?
While it is the official metric used to define a recession, it is technically a backward looking indicator. By the time the government officially reports two consecutive quarters of negative growth, the economy has already been actively shrinking for at least six full months, meaning the financial pain is already being felt by workers. To actually predict a recession before it happens, economists look at forward looking indicators like consumer confidence surveys, building permits for new homes, and the manufacturing orders for raw materials.
Does GDP measure wealth or income?
It strictly measures income and production over a very specific period of time, it does not measure accumulated national wealth. If a country produces a massive amount of goods this year, its output is technically high. However, if that same exact country has massive national debt, crumbling public infrastructure, and citizens with absolutely zero personal savings, its actual true wealth is quite low. You can think of economic output like a person’s annual salary, while national wealth is more like their total lifelong net worth.
What is the GDP price deflator?
The price deflator is a highly specific statistical tool used by economists to adjust the nominal data and convert it into real data. It essentially measures the changes in prices for all the goods and services produced in an economy. By applying the price deflator to the raw nominal numbers, economists can strip away the illusion of inflation and see exactly how much the actual volume of production has grown or shrunk over time.
How does purchasing power parity (PPP) affect GDP?
Purchasing power parity is an incredibly clever economic theory used to compare the true standard of living between different countries. Since the cost of living varies wildly across the globe, a raw conversion of economic output using standard currency exchange rates is often highly misleading. PPP adjusts the economic data to account for exactly how much a basket of everyday goods actually costs in each local country. This allows economists to accurately compare the real purchasing power of an average citizen in Germany against an average citizen in Japan.