
Flip on any financial news network or scroll through money Twitter, and you hear people shouting about bulls and bears. They are the ultimate mascots of Wall Street. But what do these terms actually mean for your bottom line?
Figuring out the difference between a bull vs bear market isn’t just Wall Street trivia. It is how you actually make money. Knowing the current cycle dictates how you manage your portfolio, protect your cash, and keep your sanity when stock prices start doing backflips. You don’t need a finance degree to grasp this stuff. You just need a basic handle on human psychology and market history.
I remember staring at my brokerage account during the sudden market drops of the past. Seeing your net worth tank in a month feels like a punch to the gut. But once you understand how these market cycles work, the panic fades. You start seeing massive drops not as the end of the world, but as clearance sales.
Let’s cut through the jargon. We’ll break down exactly what drives these markets, look at the cold hard data driving the market right now in 2026, and outline the exact moves you need to make to protect your wealth—no matter which animal is running the show.
Defining the Bull vs Bear Market
At the end of the day, these two terms just track where the stock market is heading. Stocks never move in a perfectly straight line. They bounce around every single day. But zoom out a few months or years, and you see clear trends. When you compare a bull vs bear market, you’re really comparing mass optimism against mass panic.
The Bull Market Explained
A bull market kicks off when stock prices jump 20% or more from a recent low. Why a bull? Think about how the animal attacks. A bull thrusts its horns straight up into the air.
During a bull run, the economy is humming. People have jobs, companies rake in record profits, and consumer spending is through the roof. Confidence is sky-high. Everyone wants to buy stocks because they assume prices will just keep climbing. This massive wave of buying actually forces prices even higher. It’s a giant, money-making feedback loop.
The Bear Market Explained
A bear market is the ugly flip side. It hits when stock prices dive 20% or more from a recent peak. Picture a bear standing on its hind legs and swiping its heavy paws violently downward. That’s your portfolio during a crash.
Bears wake up when the economy hits a wall. You see companies missing earnings targets, inflation spiking, or unemployment ticking up. Investors get spooked. They dump their stocks to protect whatever cash they have left. This aggressive selling tanks prices further, triggering a vicious cycle of fear.
|
Feature |
Bull Market |
Bear Market |
|
Market Trend |
Upward (prices jump 20%+) |
Downward (prices tank 20%+) |
|
How People Feel |
Confident, greedy, ready to buy |
Scared, pessimistic, ready to sell |
|
The Economy |
Growing fast, jobs are plentiful |
Slowing down, layoffs happening |
|
The Mascot Move |
Horns thrusting up |
Claws swiping down |
Historical Trends and Real Data: How Long Do They Last?
If you feel your heart rate spike when the market drops, pull up a historical stock chart. It’s the best anti-anxiety medicine out there. The news media loves to sell panic during a crash because fear gets clicks. But the actual math tells an incredibly comforting story.
The Average Bull Market Length
Bulls have serious stamina. Historically, periods of market growth last way longer than crashes. Looking at the latest data from Stifel and Hartford Funds, the average bull run stretches for about 4.9 years.
And the gains during these years are massive. The average cumulative return during a historical bull market sits around 177.6%. Take the market we are sitting in right now. Entering 2026, the S&P 500 has continued its multi-year bull run, with major banks like Goldman Sachs projecting the index to hit 8,000 by year-end, driven by massive 24% annual earnings growth. If you look at modern history, the stock market goes up roughly 78% of the time. The odds heavily favor the patient investor.
The Average Bear Market Length
Bears are brutal, but they run out of gas quickly. Yes, checking your app and seeing a sea of red is terrifying. But these downturns don’t last long.
The average bear market lasts around 289 days—just under 10 months. The average total loss hovers around 35%. Losing a third of your money hurts. But here is the kicker: the massive gains of the next bull market always wipe out those temporary losses. Plus, about 42% of the market’s absolute best trading days happen right in the middle of a bear market. If you panic sell, you miss the fastest rebound days entirely.
To see how extreme the difference in duration and upside is, try adjusting the parameters in this visualization tool:
|
The Numbers |
Bull Market Stats |
Bear Market Stats |
|
Average Lifespan |
About 4.9 years |
Roughly 289 days |
|
Average Move |
+177.6% total return |
-35.1% total drop |
|
Time in Control |
~78% of modern history |
~22% of modern history |
|
The Big Rebounds |
Misses the fastest bounce backs |
Hosts 42% of the best trading days |
What Causes a Bull vs Bear Market?
Markets don’t magically rise and fall. They react to real-world triggers. Pay attention to a few key economic drivers, and you quickly understand why your stocks are suddenly soaring or sinking.
Economic Drivers of a Bull Market
A few specific things need to happen to keep a bull running.
- Cheap Money: When the Federal Reserve keeps interest rates manageable, borrowing money is cheap. Companies take out loans to build factories, hire workers, and buy back stock.
- Massive Profits: When companies crush quarterly earnings reports, investors line up to buy their shares. In 2026, corporate earnings are driving the rally completely, creating a strong fundamental floor.
- Tech Booms: Massive leaps in technology create massive wealth. We saw it with the internet in the 90s, and we see it now with the “Phase 2” AI revolution. Capital is flowing from hardware makers into healthcare, logistics, and finance companies using AI to slash costs.
- Steady Prices: When inflation is tame, your paycheck goes further. People spend money at businesses, driving up corporate revenues.
Economic Triggers of a Bear Market
It usually takes a major shock to kill a bull market and wake up the bear.
- Expensive Money: When inflation runs hot, central banks hike interest rates. Business loans get expensive. Companies stop growing, and the economy hits the brakes.
- Recession Panic: If the economy starts shrinking, businesses fire people. Unemployed folks don’t buy new iPhones or eat out. Profits dry up.
- Black Swans: Unpredictable nightmares cause instant panic selling. Think global pandemics or geopolitical conflicts that threaten oil supplies.
- Popping Bubbles: Sometimes investors get entirely too greedy and bid up terrible companies to insane prices. Eventually, reality hits, the bubble pops, and the market crashes.
|
Market Driver |
Makes Stocks Go Up (Bull) |
Makes Stocks Crash (Bear) |
|
Interest Rates |
Lower rates, cheap loans |
High rates, expensive debt |
|
Corporate Profits |
Breaking records, strong growth |
Missing targets, shrinking margins |
|
Global Events |
Peace, massive tech innovations |
Wars, pandemics, supply chain busts |
|
Valuations |
Prices match actual company value |
Asset bubbles completely pop |
Investor Psychology: How Emotions Drive the Market
You can’t master a bull vs bear market without talking about your brain. The stock market is basically a massive scoreboard tracking human emotion. Fear and greed run Wall Street.
The Bullish Mindset: FOMO and Confidence
When everyone around you makes money, greed takes over. You see your neighbor buy a new boat because he bought a random tech stock, and suddenly you want in. That’s FOMO—the fear of missing out.
At the peak of a bull market, people lose their minds. They stop looking at what a company actually does. They buy stock simply because the line on the chart points up. People borrow money to buy more shares. This dangerous phase is called irrational exuberance. Investors completely forget that stocks can actually go down.
The Bearish Mindset: Panic and Capital Preservation
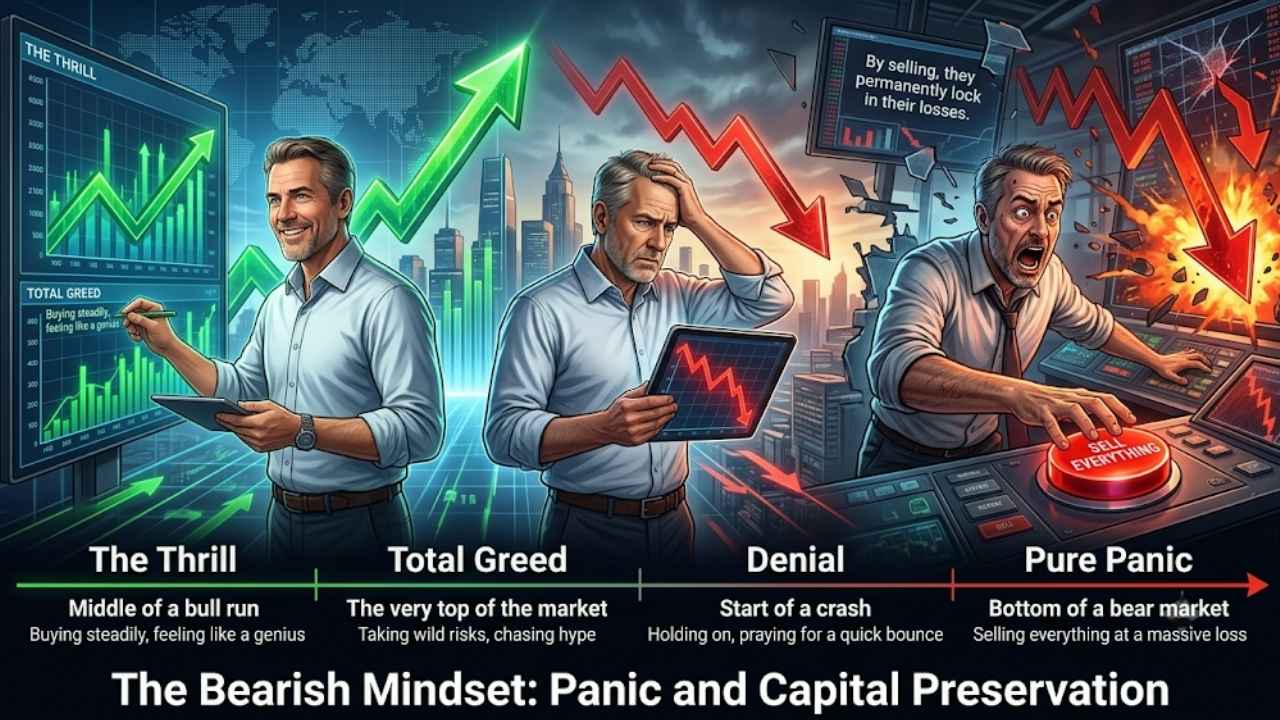
Then the music stops. Prices tank. Human biology kicks in. Your brain treats losing money the exact same way it treats a physical threat. Your fight-or-flight response fires up.
Instead of looking at a 30% market drop as a chance to buy great companies on clearance, people panic. They log into their accounts, hit sell, and swear they will never invest again. By selling, they permanently lock in their losses. The pros know that bear markets are for buying, but regular folks let fear dictate their trades.
|
Emotional Phase |
Where We Are |
What People Usually Do |
|
The Thrill |
Middle of a bull run |
Buying steadily, feeling like a genius |
|
Total Greed |
The very top of the market |
Taking wild risks, chasing hype |
|
Denial |
Start of a crash |
Holding on, praying for a quick bounce |
|
Pure Panic |
Bottom of a bear market |
Selling everything at a massive loss |
Smart Strategies to Maximize a Bull Market
When stocks are surging, it feels impossible to lose money. But you still need a game plan. You want to capture upside without leaving yourself completely exposed to the inevitable drop.
Ride the Momentum with Growth Stocks
Growth stocks belong to companies growing their sales faster than the average business. Think aggressive tech companies, AI developers, and green energy hardware. During a boom, investors gladly pay a premium for these stocks.
Buy, Hold, and Ignore the Noise
Don’t overcomplicate this. Day trading is a great way to lose your shirt. The easiest and most effective strategy is to buy low-cost index funds that track the whole S&P 500. Buy them, hold them, and go live your life. Let the rising tide of the market lift your net worth automatically.
Avoid Margin at All Costs
When stocks only go up, borrowing money from your broker to buy more shares (trading on margin) looks tempting. Don’t do it. If the market suddenly tanks, your broker issues a margin call. They force you to sell your stocks at the absolute worst time just to pay them back. Invest with cash you actually own.
|
Bull Market Move |
How It Works |
Why You Do It |
|
Buy Growth Stocks |
Target fast-growing tech/innovators |
Catch the biggest price jumps |
|
Hold Index Funds |
Buy the whole market via ETFs |
Keep it simple and guarantee returns |
|
Use Cash Only |
Refuse to trade on margin |
Prevent devastating forced sell-offs |
Defensive Moves to Survive a Bear Market
Bear markets build real wealth. When great companies go on a fire sale, investors with cash and a cool head make a fortune. You just have to survive the storm.
Embrace Dollar-Cost Averaging (DCA)
If you have $10,000 to invest, dumping it all into a crashing market is terrifying. What if it drops another 10% tomorrow? Instead, use DCA. Invest $500 every single week, no matter what the market does. When prices drop, your $500 automatically buys more shares. It removes emotion and guesswork out of investing.
Pivot to Dividend and Defensive Stocks
Even in a brutal recession, people buy toothpaste, take their medication, and pay electric bills. These defensive stocks—companies making consumer staples and utilities—don’t drop as hard as flashy tech stocks during a panic. Better yet, they pay high dividends, handing you hard cash while you wait for the market to recover.
Maintain a Strict Cash Cushion
Never put your rent money in the stock market. Keep three to six months of living expenses in a boring, high-yield savings account. If a bear market hits, the economy stalls, and you lose your job, you have cash to live on. You won’t be forced to sell your stocks at a 40% loss just to buy groceries.
|
Bear Market Move |
How It Works |
Why You Do It |
|
Dollar-Cost Average |
Invest small amounts on a set schedule |
Buy cheaper shares without timing the bottom |
|
Buy Defensives |
Focus on consumer staples and utilities |
Limit your losses and collect dividends |
|
Hold Cash Reserves |
Keep 3-6 months of expenses in a bank |
Avoid selling stocks to pay your rent |
Can You Predict Market Cycles?
We all want to know the exact day a bull market ends and a bear market starts. Bad news: nobody knows. Not the guys on TV, not billionaire hedge fund managers, and definitely not finance influencers.
The Trap of Market Timing
Trying to time the market is a fool’s game. Say you get spooked and pull all your money out in cash. If you miss just the 10 best days in the stock market over a decade, your returns get crushed. Those best days usually happen right in the middle of a bear market when things look the bleakest.
Leading Indicators to Watch
You can’t predict exact dates, but you can read the room. Financial pros watch a few key indicators.
- The Yield Curve: Normally, long-term government bonds pay more interest than short-term ones. When that flips (an inverted yield curve), it’s a giant flashing warning sign that a recession is likely coming.
- The VIX: Wall Street calls this the fear gauge. If the VIX spikes above 25, it means big institutional investors are betting on violent price swings. The market shifts from “buy the dip” to “sell the rip.”
- Credit Spreads: If high-yield bond spreads widen suddenly, it signals that the corporate sector is struggling to refinance debt.
|
Warning Sign |
What It Measures |
What It Means for You |
|
Yield Curve |
Short vs long-term bond rates |
Inversions mean a recession is likely close |
|
VIX Index |
Expected market turbulence |
High VIX means fear and choppy waters ahead |
|
Credit Spreads |
The cost of corporate debt |
Widening spreads mean companies are struggling |
Final Thoughts
The stock market is a highly efficient machine designed to transfer money from impatient people to patient people. Once you truly understand a bull vs bear market, you stop seeing volatility as a threat. You start seeing it as your biggest opportunity.
Bull markets are your time to aggressively build wealth and let compound interest do the heavy lifting. Bear markets are just clearance events—temporary moments where the greatest companies on earth go on sale. Stop trying to predict what the market will do next Tuesday. Build a solid portfolio, keep a heavy cash emergency fund, buy consistently through the crashes, and let time make you rich.
Frequently Asked Questions (FAQs) About Bull vs Bear Market
What does a “broadening” bull market mean?
You hear analysts talk about this right now in 2026. A broadening market happens when the rally shifts from just a handful of massive tech stocks (like the Magnificent 7) to the rest of the S&P 500. Capital rotates into cyclicals, industrials, and mid-cap stocks. It is a sign of a very healthy, sustainable market.
What is the “Phase 2” AI rally driving the current market?
Phase 1 was all about the companies building the hardware (like Nvidia). Phase 2 is about the adopters. We are currently seeing a bull run led by companies in finance, logistics, and healthcare that are utilizing AI tools to dramatically slash their operational costs and boost profit margins.
How often do bear markets actually happen?
They are completely normal. Since 1945, we get a bear market roughly once every five years. If you invest from age 20 to age 70, you live through about 10 to 14 of them. Get comfortable with the rollercoaster.
Should I pause my 401(k) when the market is crashing?
Absolutely not. Pausing your retirement contributions during a crash is the single worst financial move you can make. When the market bleeds, your bi-weekly paycheck buys shares at a massive discount. Keep the money flowing.
What is a secular vs cyclical market?
A secular market is a huge, overarching trend lasting decades, driven by major tech shifts. A cyclical market is a shorter trend lasting a year or two. You can easily have a nasty one-year cyclical bear crash right in the middle of a 20-year secular bull market run.


