
The stock market often looks like a giant casino to outsiders. But for those paying close attention, it is a highly calculated battleground. On one side, you have the adrenaline junkies chasing the next massive tech disruptor. On the other, the bargain hunters digging through boring financial statements looking for overlooked gems.
The debate over growth vs value investing has divided Wall Street for decades. Everyone wants to know the ultimate answer: which strategy actually puts more money in your pocket over a long timeline? If you look at the 2010s, growth investors looked like absolute geniuses, riding zero-percent interest rates to massive tech valuations. But if you zoom out and look at nearly a century of market data, the story shifts dramatically.
Recent market dynamics, driven by inflation spikes, shifting Federal Reserve policies, and massive concentration in the top index funds, prove that market leadership is a rotating door. Let’s cut through the noise, drop the complicated financial jargon, and look at the gritty reality of how these two heavyweights actually perform in the real world.
The Core Difference: Growth vs Value Investing Explained
Before you put a single dollar into the market, you need to understand the DNA of the stocks you are buying. You are not just buying a ticker symbol; you are buying a very specific business model and capital structure. When we talk about growth vs value investing, we are really talking about how a company uses its cash today to generate wealth for you tomorrow. Growth investors buy companies that are expanding revenues and earnings much faster than the broader market.
These companies might not even turn a massive profit today, but they promise explosive earnings down the road. Think of a hot new software company or an artificial intelligence pioneer. Because they are growing so fast, these companies take almost every dollar they make and plow it right back into research, development, hiring, and expansion. You do not buy growth stocks for a steady, passive income stream. You buy them hoping the stock price doubles or triples over the next five years. You are paying a premium price today for a massive theoretical payoff tomorrow.
Conversely, value investing is the stock market equivalent of buying a slightly dented luxury car at a massive discount. You are looking for established, mature companies that the market has temporarily ignored, misunderstood, or punished. Maybe a highly profitable regional bank had a bad public relations quarter, or a massive energy company is out of favor because of short-term political news. Value investors buy these companies for less than their true intrinsic value and wait for the rest of the market to wake up and correct the price. While they wait for the stock price to rise, they usually collect a fat dividend yield. They prioritize actual, current cash flows over distant promises.
|
Feature |
Growth Stocks |
Value Stocks |
|
Core Goal |
Capital appreciation (stock price goes up). |
Bargain hunting (buying below intrinsic worth). |
|
Dividend Policy |
Very rare. Profits are entirely reinvested. |
Highly common. They pay you cash to hold them. |
|
Current Valuations |
High P/E ratios. Expensive up front. |
Low P/E ratios. Traded at a deep discount. |
|
Typical Sectors |
Tech, biotech, consumer discretionary, AI. |
Financials, energy, healthcare, industrials. |
|
Volatility Level |
High. Very sensitive to market sentiment. |
Lower. Typically offers a cushion during downturns. |
A Century of Data: How the Strategies Perform Over Time
When digging into historical market performance, the data reveals a fascinating story of rotating dominance. Neither side wins forever, but one side historically holds a distinct, undeniable mathematical edge over the long haul. According to extensive historical data from institutional researchers, value stocks have outperformed growth stocks in the United States by an average of roughly four percent annually since the late 1920s. For nearly a century, value investing was the undisputed king of Wall Street.
If you bought cheap stocks with good cash flow, you consistently beat the flashy tech and speculative companies over any ten-year rolling period. Through the 1970s, 1980s, 1990s, and 2000s, value stocks outperformed their growth counterparts in nearly every capitalization range. For example, in the 1970s alone, large value delivered roughly twelve percent annualized returns versus just three percent for large growth. That nine-percentage-point gap, when compounded over a decade, created dramatic wealth differences for long-term investors.
However, the 2010s broke this historical pattern entirely. Following the 2008 financial crisis, global central banks slashed interest rates to zero. Suddenly, money was virtually free to borrow, and inflation was non-existent. In a world with zero percent interest rates, investors stopped caring about boring utility companies paying a moderate dividend. They wanted software companies growing revenues rapidly. The 2010s marked the first full decade since the 1950s where growth entirely dominated value, prompting many retail investors to wrongly assume value investing was permanently dead.
|
Decade |
The Winning Strategy |
The Underlying Economic Reason |
|
1970s |
Value |
High inflation and stagnant economic growth crushed high-multiple stocks. |
|
1980s |
Value |
Economic recovery favored cyclical businesses like industrials and banks. |
|
1990s |
Value (Mostly) |
Value led early, but growth exploded late in the decade due to the dot-com boom. |
|
2000s |
Value |
The tech bubble burst, wiping out growth. Value was a safe haven. |
|
2010s |
Growth |
Zero-interest rates and low inflation made tech stocks entirely unstoppable. |
|
2020s |
Mixed |
Growth won the pandemic; Value surged in 2022; Growth returned via AI. |
Market Concentration in the 2020s: The Tech Giant Anomaly
You cannot have a modern conversation about investing without addressing what happened to the core index funds in the mid-2020s. By 2025 and 2026, the stock market experienced an extreme narrowing event driven by the artificial intelligence boom. A tiny handful of mega-cap tech stocks pushed market indices to unprecedented valuations. By mid-2026, the ten largest companies in the primary market index accounted for over one-third of the total index weight.
Giants like Nvidia, Apple, Alphabet, Microsoft, and Amazon commanded massive premiums. Just ten years prior, that top-heavy concentration sat around nineteen percent. This extreme concentration means that when you buy a standard, market-cap-weighted index fund today, you are making a massive, concentrated bet on growth.
You are no longer highly diversified across the broad American economy. You are heavily tied to the performance of a few tech giants. This dynamic pushed the valuation gap to historic extremes. Going into 2026, standard growth indexes were trading at Price-to-Earnings ratios near twenty-eight, while pure value indexes sat at a much cheaper ratio of around thirteen. The Shiller cyclically adjusted price-to-earnings ratio breached forty, a level only previously seen during the dot-com bubble. Historically, whenever the gap between growth and value gets this wide, it sets the stage for a vicious market rotation where value aggressively plays catch-up.
|
Market Metric (2026) |
The Data Point |
Why It Matters to Investors |
|
Top 10 S&P 500 Weight |
Over 35% |
Passive index investors are accidentally tech-heavy. |
|
S&P 500 CAPE Ratio |
Over 40 |
Reaching levels last seen during the dot-com bubble. |
|
Value Index P/E |
13 |
Value stocks are trading at a massive historical discount. |
|
Growth Index P/E |
28 |
Investors are paying high premiums for future earnings. |
The Interest Rate Reality Check: Why Money Matters
You cannot understand the stock market without understanding the cost of capital. A massive part of the investing dynamic comes down to interest rates and how Wall Street values future money. The simple math explains exactly why growth stocks hate high interest rates. When you buy a hyper-growth stock, you are paying a premium today for profits the company will theoretically generate ten years from now.
Analysts use a discounted cash flow model to figure out what those future profits are worth today. When interest rates are nearly zero, a dollar promised to you a decade from now is still worth a lot today, because you cannot make any money keeping your cash in a savings account anyway. You are perfectly willing to take a risk on a tech stock.
But when inflation spikes and interest rates jump to five percent, you can suddenly get a guaranteed, risk-free return just by buying government bonds. Suddenly, that risky promise of tech profits ten years from now looks a lot less appealing. The discount rate goes up, meaning those future earnings are worth significantly less today. This is exactly why the tech sector bleeds when central banks hike rates, and why value sectors like energy, industrials, and financials skyrocket during those exact same periods.
|
Economic Environment |
Who Wins? |
The Underlying Reason |
|
Low Interest Rates |
Growth |
Future cash flows are highly valued; borrowing money to expand is dirt cheap. |
|
High Interest Rates |
Value |
Future earnings are discounted heavily; investors demand cash in hand today. |
|
Rising Inflation |
Value |
Value sectors (like energy/commodities) act as natural hedges against inflation. |
|
High Market Volatility |
Value |
Uncertainty makes investors prefer immediate dividends over theoretical promises. |
Key Valuation Metrics Every Investor Should Know
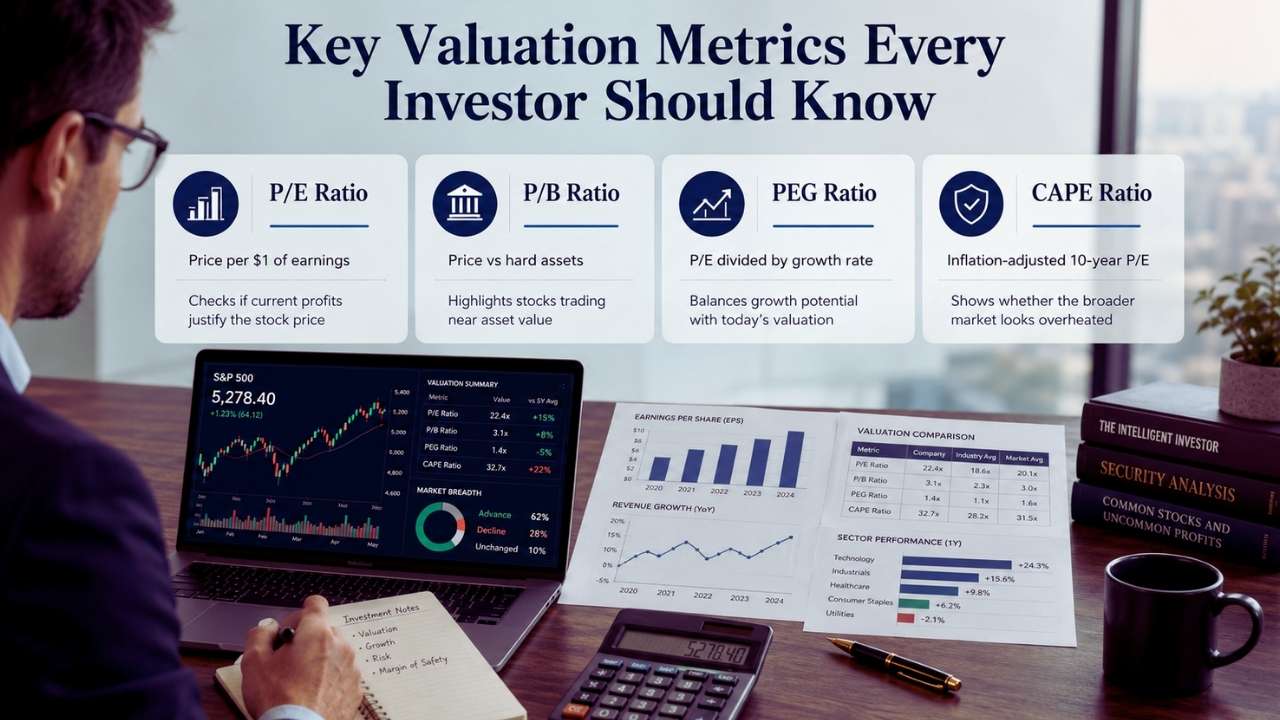
If you want to pick your own stocks, you need to know how to read the price tag. When you look at the fundamental math, you cannot ignore the core metrics that separate an expensive stock from a genuinely cheap one. The Price-to-Earnings ratio is the most common tool. It measures how much you are paying for one dollar of current earnings. Value investors actively seek low ratios, often under fifteen, while growth investors gladly accept high ratios, assuming the earnings will eventually catch up to the price.
Another vital metric is the PEG ratio, which takes the price-to-earnings metric and divides it by the projected growth rate. This helps investors find high-flying stocks that are not absurdly overpriced relative to their actual expansion speed. Value investing also relies heavily on dividend yield, prioritizing consistent cash returns during flat markets.
However, traditional metrics have flaws today. For decades, the Price-to-Book ratio was the holy grail of bargain hunting. It measures a company’s stock price against its actual physical assets like factories and inventory. But the modern economy runs on algorithms, patents, and software. Traditional accounting rules do not count research and development as hard assets. Because of this, traditional metrics often make tech companies look artificially expensive, while making dying manufacturing companies look like incredible bargains.
|
Metric |
What It Actually Measures |
How It’s Used in Strategy |
|
P/E Ratio |
Price per $1 of earnings. |
Determines if you are overpaying for current profits. |
|
P/B Ratio |
Price compared to hard assets. |
Finds companies trading below their liquidation value. |
|
PEG Ratio |
P/E divided by growth rate. |
Balances growth potential against the current price tag. |
|
CAPE Ratio |
Inflation-adjusted 10-year P/E. |
Gauges if the entire broader market is dangerously overvalued. |
The Psychology of Losing Money: Traps to Avoid
The biggest mistake retail investors make is assuming they have to pick a permanent side. Investors constantly lose money because they let their emotions and recency bias drive their portfolio strategy. Value investors love a bargain, but sometimes a stock is cheap for a very good reason. If a legacy retail chain trades at a single-digit multiple, it might look like an absolute steal.
But if they are bleeding market share to e-commerce, drowning in corporate debt, and changing executives every six months, that is not a bargain. That is catching a falling knife, widely known as a value trap. A true value stock has solid fundamentals and strong cash flow, but is suffering from temporary market pessimism.
On the other side, growth investors suffer heavily from the mirage of infinite expansion. If a stock went up fifty percent last year, human psychology assumes it will do it again this year. Investors end up paying astronomical premiums for a company that realistically only grows its actual revenue by ten or fifteen percent a year. When Wall Street wakes up and corrects the valuation, the stock plummets, even if the underlying company is perfectly healthy. You can buy a great company, but if you pay a terrible price, it is still a bad investment.
|
The Investor Trap |
Who Usually Falls For It |
The Financial Consequence |
|
Performance Chasing |
Growth Investors |
Buying a tech stock after it surges 300%, right before the bubble inevitably pops. |
|
The Value Trap |
Value Investors |
Buying a cheap stock that is cheap because the business is actually going bankrupt. |
|
Ignoring the Cycle |
Both Styles |
Holding tightly onto a strategy when the macroeconomic environment shifts entirely against it. |
|
The Behavior Gap |
Fund Investors |
Panic-selling a volatile fund during a dip, missing the eventual massive rebound. |
Global Divergence: Why the US and International Markets Look Different
The debate around these strategies looks completely different depending on where you are investing in the world. As of 2026, recent market analysis reveals a massive geographical divergence. Inside the United States, growth continues to win out largely due to the artificial intelligence boom and the dominance of specific tech mega-caps. But if you strip out those few massive companies, the track record for growth investing largely falls apart globally. Over the last five years leading up to 2026, value investing quietly reasserted itself across most of the world.
In Europe, Latin America, and emerging markets, value has dominated. International markets are heavily skewed toward legacy banks, mining companies, and massive industrial firms. They completely lack the multi-trillion-dollar software giants that dominate the American exchanges. When global inflation stayed stubborn and interest rates remained higher for longer, these international value sectors thrived.
They generated massive free cash flow and paid hefty dividends, completely outpacing speculative international growth stocks. Therefore, if you are building a globally diversified portfolio today, your international holdings will naturally act as a heavy value tilt, perfectly offsetting the massive growth bias found in domestic American index funds.
|
Region |
Dominant Strategy (2026) |
Driving Factors |
|
United States |
Growth |
Artificial intelligence boom and mega-cap tech concentration. |
|
Europe |
Value |
Strong banking sector earnings and legacy industrial strength. |
|
Latin America |
Value |
Heavy reliance on commodities, mining, and energy exports. |
|
Emerging Markets |
Value |
Higher interest rate environments favoring cash-flowing businesses. |
How to Build a Bulletproof Portfolio?
You do not need to choose a permanent side. In fact, choosing just one is a fantastic way to guarantee a decade of brutal underperformance at some point in your life. The smartest money managers use a blended approach to smooth out the ride. If you dumped all your money into bargain stocks in 2010, you spent ten agonizing years watching your friends get rich on tech. If you went all-in on hyper-growth tech in late 2021, you lost half your net worth the following year when rates spiked. The most reliable strategy is disciplined asset allocation. Mix the styles intentionally.
When tech stocks take off, your portfolio captures the upside. When the tech sector crashes and mature sectors step up to the plate to carry the market, your dividends keep you afloat. Many investors utilize a core-and-satellite approach. They put eighty percent of their money into a broad total market index fund, ensuring they own every sector automatically.
Then, they use the remaining twenty percent to make tactical bets on specific trends, like artificial intelligence or energy infrastructure. Blending both strategies prevents you from suffering massive drawdowns during sector rotations, keeping you invested through all market conditions.
|
Portfolio Strategy |
How It Actually Works |
Best Suited For |
|
Total Market Indexing |
Buying a broad index like VTI. |
The set-it-and-forget-it investor. You own both styles automatically. |
|
Core and Satellite |
80% broad index fund, 20% tactical bets. |
Hands-on investors who want to capture specific trends safely. |
|
GARP Investing |
Growth At a Reasonable Price. |
Investors who want capital appreciation without paying bubble prices. |
|
The Barbell Strategy |
50% extreme tech and 50% deep value. |
Investors wanting aggressive upside while protecting downside with dividends. |
Final Thoughts
The financial media loves to treat the stock market like a sporting event, constantly trying to crown a permanent champion. But the reality of the market is deeply cyclical. Decades of historical data prove there is no permanent winner in the growth vs value investing debate. Economic cycles dictate market leadership. Cheap money and low inflation fuel the explosive, headline-grabbing potential of fast-expanding companies. Conversely, expensive money, high interest rates, and market volatility heavily favor the safety, physical assets, and immediate cash flow of mature businesses.
You can overpay for a fantastic company, and you can buy a terrible company just because it looks cheap on paper. Both extremes carry massive risks that routinely ruin retail portfolios. At the end of the day, successful wealth building is not about finding a single strategy to blindly follow for the rest of your life.
Blending both strategies prevents you from suffering massive drawdowns during inevitable sector rotations. Stop treating your portfolio like a casino bet on red or black. Mix the stability and dividends of mature businesses with the upside potential of rapid expanders, tune out the daily market panic, and let compound interest do the heavy lifting.
Frequently Asked Questions (FAQs) About Growth vs Value Investing
Does international investing favor one strategy over the other?
Yes, heavily. Outside the United States, the global stock market is heavily skewed toward value sectors. European and emerging markets are packed with legacy banks, mining companies, and massive industrial firms. They completely lack the mega-cap tech giants that dominate the US. If you want global diversification, you naturally have to lean toward value investing.
Will Artificial Intelligence kill value investing?
No. While AI pushes software valuations sky-high, the physical world still matters. The companies building the physical infrastructure for AI—the utility companies generating the massive amounts of electricity required, and the industrial firms building the data centers—are classic value plays. In 2025 and 2026, analysts noted the AI boom actively broadening out to these value sectors, driving massive gains for unglamorous infrastructure stocks.
Are standard index funds completely neutral?
Not anymore. By design, most index funds are “market-cap weighted.” This means the bigger a company gets, the larger portion of the fund it takes up. Because US tech companies grew to multi-trillion-dollar valuations, standard index funds became incredibly top-heavy with growth stocks (nearly 41% in the top 10). To balance this, many advisors now suggest adding a specific “Small-Cap Value” fund to your portfolio to level things out.
Are stock buybacks a value or growth trait?
Traditionally, aggressive stock buybacks are a value trait. When a mature company generates more cash than it knows what to do with, it buys its own shares off the open market and retires them. This shrinks the supply of shares, making your remaining shares more valuable. However, in recent years, massive tech giants (growth stocks) have generated so much cash they are also doing massive buybacks, blurring the lines between the two styles.


