


Turn on the financial news during a market meltdown, and you will immediately see a sea of red tickers. Pundits start talking over each other, desperately trying to assign blame. Eventually, amidst the shouting about tech stocks, real estate, or inflation, someone inevitably brings up the bond market.
If you do not trade on Wall Street for a living, you are probably asking exactly what is yield curve inversion and why does it make experienced, wealthy investors break out in a cold sweat? It sounds like dense, untouchable financial jargon meant to confuse the average person. But once we drop the fancy terminology, it is a completely straightforward and fascinating concept. Think of the global bond market as a massive, intricate lending machine that dictates the cost of money worldwide.
How that specific machine prices risk tells us exactly what the “smart money” expects to happen next in the real economy. When the system decides short-term risk is actually worse than long-term risk, it breaks its own fundamental rules. And when that happens, the stock market usually panics. Let us break down exactly how this works, look at real-time 2026 data, and figure out what this upside-down market means for your hard-earned money.
The Basics: What Normal Looks Like
Before we get into the weird stuff, we need to completely understand what “normal” means in the financial world. When you buy a government bond, such as a United States Treasury, you literally just loan the government your money for a set period. In exchange for borrowing your cash, the government promises to pay you regular interest. The financial world calls that specific interest rate the “yield.” Under perfectly healthy economic conditions, time equals risk. You expect the future to be brighter, but you also know that locking your money up for a decade carries hidden dangers.
If you lock your cash away in a 10-year bond, you take on way more risk than lending it out for just three short months. Over a decade, consumer inflation might spike drastically, or the entire economy could tank. Because you take on significantly more risk waiting ten years to get your principal back, you demand a much higher yield to make it worth your while. When you plot these yields on a graph, with short-term bonds on the left and 30-year bonds on the right, the line naturally slopes upward. This upward slope is your normal yield curve. It flashes a giant green light to the world, telling us that investors expect steady growth, normal inflation, and business as usual.
Read Also: REITs Explained: How to Invest in Real Estate Without Buying Property
|
Normal Curve Concept |
What It Actually Means for You |
Market Expectation |
|
Time Horizon |
Longer maturity bonds pay higher rates to offset future risk. |
The future is stable enough to wait for returns. |
|
Economic Signal |
Investors expect steady corporate growth and normal inflation. |
The economy is expanding at a healthy pace. |
|
Banking Impact |
Banks easily profit by borrowing short and lending long. |
Credit flows freely to consumers and businesses. |
What Is Yield Curve Inversion Exactly?
Sometimes, the standard financial script completely flips upside down. The economy looks incredibly shaky, consumer inflation runs hot, and institutional investors get incredibly nervous about the immediate future. To protect their massive piles of cash, they swarm to the safety of long-term government bonds to lock in secure returns before the entire economic landscape gets worse. Here is exactly where the basic laws of supply and demand kick in and bend the market. When global demand for 10-year government bonds shoots up, the price of those bonds immediately goes up. Since bond prices and yields always move in opposite directions like a mathematical seesaw, the yield on those long-term bonds drops aggressively.
At the exact same time, the Federal Reserve usually hikes up short-term interest rates to fight off rising inflation. This massive tug-of-war creates a highly bizarre situation where a 6-month or 2-year note starts paying a higher interest rate than a 10-year bond. This upside-down setup is the exact textbook definition of what is yield curve inversion. The line on the graph stops sloping up and starts pointing straight down. This inversion serves as a giant warning siren. It explicitly tells the world that the most sophisticated investors on earth believe the near-term future is so risky that they would rather accept lower payouts a decade from now just to guarantee their money stays safe today.
Want to see how short-term and long-term interest rates physically bend the curve? Play with this interactive tool to visualize an inversion right now.
|
Curve State |
Visual Shape on the Graph |
What It Tells the Market |
|
Normal |
Slopes upward; long-term rates are higher. |
Healthy economic expansion; optimistic outlook. |
|
Flat |
A straight line; short and long rates are equal. |
Transition phase; extreme uncertainty is brewing. |
|
Inverted |
Slopes downward; short rates pay noticeably more. |
Severe warning; an economic recession is highly likely. |
Why Do Markets Freak Out?
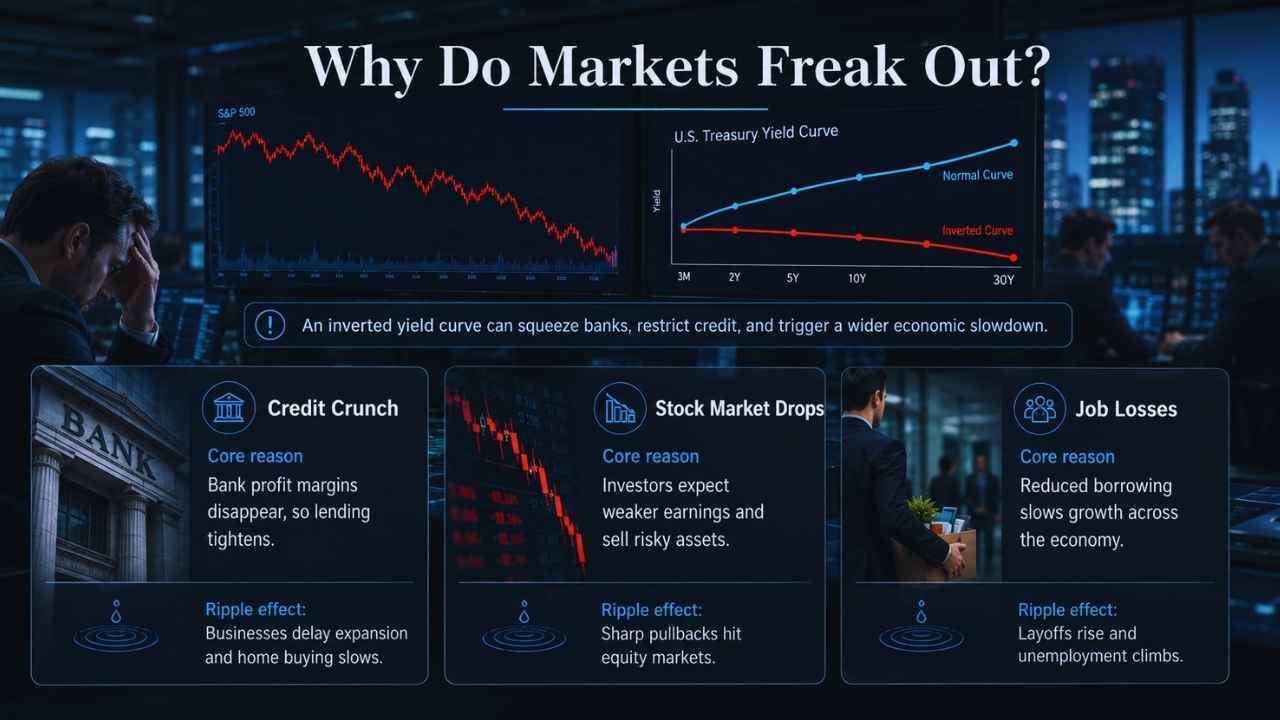
The sheer panic you see on television is not just about a line pointing the wrong way on a fancy chart. The bond market literally controls the plumbing for the entire global financial system, and when the curve inverts, that plumbing backs up violently. To grasp why this matters so much to your daily life, you have to look at how commercial banks actually make their money. Their foundational business model relies entirely on a normal yield curve. Banks pay you a very low short-term rate on your checking or savings account. They take that massive pool of deposited money and lend it out at a much higher, long-term rate for things like 30-year family mortgages or multimillion-dollar business expansion loans.
They simply pocket the difference between the low rate they pay you and the high rate they charge the borrower. The financial sector calls this the net interest margin. When the curve inverts, that crucial profit margin completely vanishes overnight. Short-term borrowing gets vastly more expensive than the long-term interest banks can reasonably charge. Since lending money suddenly becomes a guaranteed loss for the bank, they aggressively tighten their standards and stop giving out loans. When this vital credit dries up, the entire economy stalls. Local businesses cannot expand, families cannot buy houses, corporate earnings miss their targets, and massive layoffs begin. This chain reaction makes an inverted curve a famously reliable predictor of deep recessions.
|
Market Impact |
The Core Reason It Happens |
The Real-World Ripple Effect |
|
Credit Crunch |
Bank profit margins disappear entirely, halting lending. |
Businesses halt expansion plans; the housing market stalls. |
|
Stock Market Drops |
Investors anticipate lower future earnings and sell rapidly. |
Triggers sharp pullbacks and bear markets in equities. |
|
Job Losses |
Reduced borrowing stalls overall economic growth. |
Corporate layoffs rise and national unemployment climbs. |
A Look at Reality: The 2022 to 2024 Mega-Inversion
We do not fear this specific metric just because old economic textbooks tell us we should. We fear it because of its absolutely ruthless historical track record over the last fifty years. An inverted curve has successfully front-run almost every single modern American recession. In early 2000, the curve inverted deeply, and just a year later, the massive tech bubble burst, sending the NASDAQ crashing. By late 2005, it flipped upside down again, staying that way through 2006 before the global housing market collapsed into the Great Recession. However, the financial event that rewrote the history books happened very recently, completely shattering previous records and confusing top economists.
Driven by extreme Federal Reserve rate hikes to fight off post-pandemic inflation, the yield curve inverted in July 2022 and stayed deeply negative for an astonishing 26 straight months. It finally un-inverted and returned to normal on September 5, 2024. That massive 2022 to 2024 mega-inversion broke all the usual predictive rules. Historically, a deep recession hits the economy 12 to 18 months after the curve flips. Yet, the American economy kept churning out surprisingly strong gross domestic product numbers for years. Consumers had trillions of dollars in leftover pandemic savings, and corporations had already locked in super-low debt rates before the Fed acted. It proved that while the alarm bell definitely works, a heavily buffered economy can take years to finally catch fire.
|
Historical Era |
Curve Inversion Duration |
What Happened Next |
|
The Tech Bubble |
Lasted nearly 10 months starting early 2000. |
The NASDAQ crashed, triggering an early 2001 recession. |
|
The Housing Crash |
Lasted around 18 months starting late 2005. |
Global housing collapsed, leading to the Great Recession. |
|
The Record Streak |
Lasted an unprecedented 26 months (2022 to 2024). |
Massive inflation fight; the economy slowed but remained resilient for years. |
The 2026 Reality: The “Un-Inversion” Danger Zone
Here is a wildly counterintuitive twist that catches most amateur investors totally off guard: the moment of maximum danger is not usually when the curve is deeply inverted. The real stock market pain almost always hits when the curve rapidly “un-inverts” and goes back to a normal upward slope. Why does this happen? A sudden un-inversion usually means the economy finally broke under the pressure. A recession has undeniably arrived, and the central bank is suddenly panic-cutting short-term rates to rescue a failing financial system. The massive inversion of the early 2020s ended, and we are currently living in the aftermath of that historic shift.
Looking directly at real-time market data in July 2026, we see a fully normalized yield curve. By early July 2026, the 10-year Treasury yield sits around 4.49 percent, while the 2-year yield has dropped significantly lower to 4.14 percent. This gives us a positive spread of 0.35 percent, confirming the un-inversion is complete. The Federal Funds rate has also dropped to 3.63 percent, and standard 30-year fixed mortgages are hovering around 6.43 percent. While the broader economy managed a surprisingly soft landing immediately following the 2024 un-inversion, market historians now view that crazy multi-year cycle as a very rare exception. Extreme inflation and excess pandemic cash temporarily masked the usual catastrophic signals, bringing us to a cautious but stable 2026 market environment.
|
2026 Market Metric |
Current July 2026 Data |
What It Means for the Economy |
|
10-Year Treasury Yield |
Sits at 4.49 percent. |
Long-term growth expectations remain cautiously stable. |
|
2-Year Treasury Yield |
Dropped to 4.14 percent. |
Short-term pressure has eased significantly from 2023 highs. |
|
Yield Curve Spread |
Positive 0.35 percent. |
The curve has officially un-inverted, ending the historic warning phase. |
Who Pulls the Strings?
You simply cannot fully grasp what is yield curve inversion without talking about the massive influence of the United States Federal Reserve. The Fed effectively controls the absolute shortest end of the yield curve by setting the Federal Funds Rate. This base rate dictates the interest rates you pay on your credit cards, auto loans, and short-term business debt. If consumer inflation runs incredibly hot, the Fed steps in forcefully and jacks up short-term rates to cool the entire economy down. They want to make borrowing so expensive that people simply stop spending money, which naturally brings prices back down to earth.
But here is the massive catch that most people miss: the Federal Reserve does not directly control the 10-year or 30-year bond yields on the back end of the curve. The open, global free market decides those long-term rates based entirely on future growth expectations. Therefore, an inversion is basically a massive financial tug-of-war. The Fed violently yanks short-term rates higher to kill today’s inflation problem, while millions of global investors drag long-term rates lower because they are betting the Fed will accidentally kill the broader economy in the process. When the free market completely disagrees with the Federal Reserve, the curve goes upside down.
|
Key Market Player |
Primary Control Mechanism |
Impact on the Overall Yield Curve |
|
Federal Reserve |
Sets short-term overnight lending rates for banks. |
Directly drives the front end (1-month to 2-year yields) up or down. |
|
Global Investors |
Buy and sell long-term Treasury bonds in the free market. |
Dictates the back end (10-year to 30-year yields) based on future bets. |
|
Consumer Inflation |
Erodes the underlying purchasing power of cash over time. |
The primary economic villain that forces the Fed to take aggressive action. |
Is a Recession Guaranteed?
Nothing in the complex world of global finance is one hundred percent guaranteed. While the yield curve nailed the prediction for almost every single pre-2020 recession, it occasionally throws out what economists call a false positive. Sometimes the overall economy slows down dramatically, the manufacturing sector slumps, and stocks take a noticeable dip, but the country manages to completely avoid an official, technical recession. An official recession generally requires two consecutive quarters of negative economic growth, and sometimes we just barely scrape by without hitting that gloomy milestone.
A famous example happened in the mid-1990s when the curve briefly inverted, but the economy managed a very rare “soft landing” and boomed for several more years. The historic 2022 to 2024 inversion cycle followed a remarkably similar, resilient path, dodging immediate catastrophe due to unusual post-pandemic factors. Furthermore, the lag time between the warning and the actual crash is infuriatingly unpredictable. As we learned recently, the economy can continue to grow for well over two years while the alarm bells ring at full volume. Still, completely ignoring this giant red warning light just because it is not utterly flawless usually ends incredibly badly for your retirement portfolio.
|
Accuracy Factor |
Explanation of the Metric |
Real-World Application |
|
Historical Track Record |
Highly accurate historically. |
Accurately predicted the 2000, 2008, and 2020 economic downturns. |
|
The Lag Time |
Recessions hit 4 to 24 months after the flip. |
Requires intense patience; the market can still rally while inverted. |
|
False Positives |
Rare, but completely possible. |
The mid-1990s and the mid-2020s showed the economy can sometimes adapt. |
Smart Moves: What to Do Next
When the bond market suddenly flashes extreme danger, it is incredibly tempting to cash out your entire retirement account and hide the money under a mattress. Do not make that catastrophic mistake. Trying to perfectly time the market is nearly impossible, and panic-selling usually means you miss out on massive late-stage bull market gains before a recession actually hits. Instead of completely panicking over scary headlines, use the yield curve inversion as a highly effective wake-up call to rigorously stress-test your personal finances. You should secure your foundation before the economic storm actually arrives on your doorstep.
Start by aggressively padding your cash buffer. If bank lending tightens and corporate layoffs start making headlines, you need immediate access to liquid cash. Park three to six months of vital living expenses in a high-yield savings account just to give yourself breathing room. Next, check your overall stock mix. Highly speculative tech stocks get absolutely crushed in recessions, so you should shift toward defensive plays like healthcare, grocery chains, and basic utilities. People still buy toothpaste and pay their electric bills during a severe downturn. Finally, grab short-term yields while you can. An inverted curve literally pays you more money for short-term debt, so buy Treasury bills or Certificates of Deposit to lock in great, risk-free interest while you wait out the cycle.
|
Financial Strategy |
Specific Action Required |
Why It Works in a Rocky Market |
|
Pad Cash Reserves |
Increase your emergency fund savings immediately. |
Protects you against sudden job loss or unexpected medical expenses. |
|
Defensive Stocks |
Pivot your portfolio toward consumer staples and utilities. |
Consumers still buy basic groceries and power regardless of the economy. |
|
Harvest Yields |
Buy short-term T-bills or high-rate bank CDs. |
Takes direct advantage of the high short-term interest rates causing the inversion. |
Final Thoughts
Financial markets rely entirely on cheap credit and the highly predictable pricing of long-term risk. When short-term debt starts paying more interest than long-term debt, it proves beyond a shadow of a doubt that the massive, trillion-dollar bond market sees incredibly dark economic clouds ahead. Once you finally understand what is yield curve inversion, you immediately gain a massive advantage over the average emotional investor. You are no longer just reacting blindly to scary television headlines or social media rumors.
You know exactly when the global banking sector is stressed out and when vital corporate credit is rapidly drying up. By carefully watching this ultimate financial warning signal, and fully respecting the notoriously tricky “un-inversion” danger phase, you can proactively protect your stock portfolio. Building up your emergency cash reserves and pivoting to defensive assets allows you to ride out the inevitable, brutal economic cycles with absolute confidence. Stay informed, ignore the short-term noise, and always watch what the bond market is quietly doing behind the scenes.
Frequently Asked Questions (FAQs) About What is Yield Curve Inversion
What spread should I actually watch?
Stock traders obsess over the 2-year vs. 10-year Treasury yields. But hardcore economists and the Fed usually watch the 3-month vs. 10-year spread. It tracks the Fed’s day-to-day moves closer, making it a purer signal of banking stress.
Why did the 2022-2024 inversion take so long to hit the economy?
Unlike the housing or tech bubbles, the 2022 flip was driven by a post-pandemic inflation shock. Consumers had trillions in leftover pandemic savings, and companies had already locked in super-low debt rates. That massive cushion delayed the usual credit crunch.
Do inversions drop mortgage rates?
Yes, but in a weird way. Mortgages tie closely to the 10-year Treasury, not the Fed’s short-term rate. Because investors rush to buy 10-year bonds during an inversion, those yields drop. That means mortgage rates can actually plateau or fall even while the Fed hikes short-term rates. By mid-2026, standard 30-year mortgages hovered around 6.4%, tracking that 10-year yield.