


Check your retirement account lately? Maybe you saw a solid 8% return this year and smiled. Your money is out there working hard. But there is a massive catch that most people miss entirely. Behind the scenes, a silent partner is shaving off a piece of your wealth every single day.
You won’t get a bill in the mail for this. You will not even see a line-item charge on your monthly statement. It just vanishes into thin air. If you want to actually keep the money your investments earn, you need to know exactly what is expense ratio.
Whether you use mutual funds, ETFs, or a slick robo-advisor app, they all charge you to manage your cash. They take their cut directly from your fund’s assets before passing the leftovers to you. Over a few months, it feels completely harmless. Over twenty or thirty years, it can wipe out hundreds of thousands of dollars. I have seen too many people lose a quarter of their nest egg to fees they did not know existed. Here is exactly how this fee works, the latest real-world data on how it impacts your investments, and how to stop it from draining your financial future.
Decoding the Basics: What Is an Expense Ratio?
I remember the first time I looked closely at my retirement statements. I saw the market gains, but I could not figure out how my provider was actually making money. I quickly learned that funds do not run on magic. They need portfolio managers, analysts, accountants, and legal teams. The expense ratio pays their salaries and covers the daily operations of the fund. Simply put, an expense ratio is the annual fee a mutual fund or exchange-traded fund charges you to keep the lights on and manage your cash.
When you first ask yourself what is expense ratio, you might think it is a bill that arrives in the mail. But you will never get an invoice for this. The financial industry is much smarter than that. They calculate the fee daily and quietly deduct it from the fund’s net asset value before the market even opens. You just get slightly lower returns than the actual market performance. Over time, this silent deduction becomes the single biggest factor in whether a fund makes you rich or just makes the fund manager wealthy.
The math behind it is incredibly simple. You divide the fund’s total operating expenses by its average net assets. Say you invest $10,000 in a fund with a 1.00% expense ratio. You are paying $100 a year for them to manage your money. If the market goes up, they take their cut. If the market crashes and you lose money, they still take their cut. It is a guaranteed revenue stream for Wall Street, pulled directly from your hard-earned savings.
|
Feature |
The Breakdown |
How It Hits Your Wallet |
|
What It Is |
An annual fee funds charge to cover operating costs. |
Drags down your overall investment returns every year. |
|
The Math |
Total Operating Expenses / Average Net Assets. |
Decides the exact percentage scooped from the asset pool. |
|
How You Pay |
Deducted daily from the fund’s Net Asset Value (NAV). |
Completely invisible. You never see the money leave. |
|
Normal Range |
0.02% up to 1.50% depending on the fund type. |
Creates a massive wealth gap over a long timeline. |
The Hidden Math: How It Devours Your Money?
Investing relies heavily on compound interest. We all love watching our money make money, and then watching that new money make even more money. It is the greatest wealth-building engine ever created. The problem is that fees compound right alongside your returns. When you figure out what is expense ratio in practical terms, you realize you are handing over your compounding power straight to financial institutions. Every single dollar you pay in fees is a dollar that stops growing for you permanently.
Let us look at the raw numbers, because they are staggering. Imagine you invest $100,000 across two different funds. Both earn an identical 8% return before fees. You do not touch the money for thirty years. Fund A is a low-cost index fund charging 0.10%. Fund B is an actively managed fund charging 1.00%. Fast forward three decades. Fund A grows to nearly $973,000. Fund B crawls up to just $761,000. The market treated both funds exactly the same, but the fee gap created a massive divide in actual wealth.
That tiny 0.90% fee difference just cost you over $212,000. You gave up more than a fifth of your total wealth for absolutely nothing. Wall Street relies on you thinking that 1% sounds like a tiny number. In a grocery store, a 1% tax is nothing. Over a thirty-year investing timeline, a 1% annual fee is an absolute disaster for your net worth.
|
30-Year Scenario |
Low-Cost Fund A (0.10%) |
Expensive Fund B (1.00%) |
The Reality Check |
|
Starting Balance |
$100,000 |
$100,000 |
Equal footing. |
|
Raw Annual Return |
8.00% |
8.00% |
The market treats both the same. |
|
Net Return (After Fees) |
7.90% |
7.00% |
A 0.90% performance drag. |
|
Final Bank Balance |
$973,000 |
$761,000 |
$212,000 permanently lost to fees. |
Active vs. Passive Funds: The Fee Divide
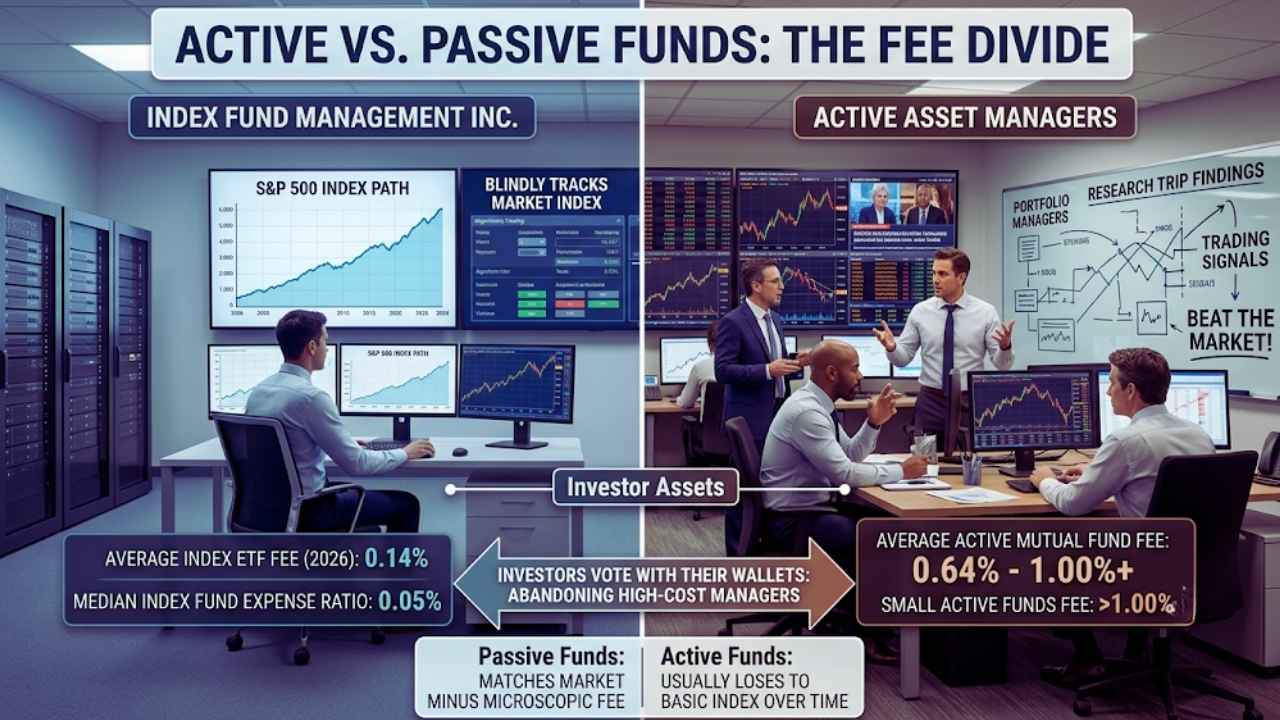
Why do some funds charge a dirt-cheap 0.03% while others demand 1.00% or more? It almost always comes down to how the fund is managed. Passive funds, like broad index ETFs, run on autopilot. A computer algorithm blindly buys the stocks in the index. No highly paid stock pickers required. Because of this, costs stay rock-bottom. Recent 2025 and 2026 data from the Investment Company Institute shows the asset-weighted average index ETF charges a mere 0.14%.
Active funds take the exact opposite approach. They hire managers to constantly trade stocks, hoping to beat the market. You pay for their fancy offices, endless research trips, and trading commissions. The joke is on the investor, though. According to Morningstar research, most active managers fail to beat simple index funds over a ten-year stretch. You pay premium fees for subpar results. Today, the asset-weighted average active equity mutual fund fee hovers around 0.64%, with many smaller funds easily pushing past the 1.00% mark.
The cost gap between index and active strategies is stark. The median expense ratio for the largest index funds is now just 0.05%. For large active funds, it sits closer to 0.45%. Investors are finally waking up to this reality. Recent market reports show that funds in the lowest cost bracket now hold 81% of all equity mutual fund assets. People are voting with their wallets and abandoning high-cost active managers at a record pace.
|
Fund Style |
The Strategy |
Average 2026 Fee |
The Track Record |
|
Passive (Index ETFs) |
Blindly tracks a market index. |
0.14% |
Matches the market minus a microscopic fee. |
|
Active Mutual Funds |
Managers buy and sell to beat the market. |
0.64% – 1.00% |
Usually loses to the basic index over time. |
|
Smart Beta ETFs |
Uses rigid rules to target specific factors. |
0.16% – 0.40% |
Hit or miss; costs land right in the middle. |
What Exactly Are You Paying For?
When you look under the hood of a mutual fund, that single percentage fee breaks down into a few distinct buckets. It is not just one big pile of cash going to the lead manager. First up is the management fee itself. This is the biggest chunk of the pie. It pays the actual salaries of the stock pickers and their army of researchers. If the fund is actively managed, this number is going to be incredibly high to cover their base pay and bonuses.
Next, you have administrative costs. Running a financial product requires a massive amount of unglamorous backend work. This covers customer service centers, keeping legal records, mailing out heavy prospectuses, and maintaining the digital infrastructure that lets you check your balance on your phone. Even passive index funds have these costs, but they keep them heavily suppressed due to their massive economies of scale.
Finally, you hit 12b-1 fees, which is a common term used in the United States, or distribution fees globally. Brace yourself, because this is literally a marketing fee. You are paying the fund so they can afford to run television ads and pay financial advisors a commission to sell the fund to other people. Smart investors stick strictly to “no-load” funds that completely skip this ridiculous charge. There is zero reason you should fund a bank’s marketing budget.
|
Where the Money Goes |
What It Actually Buys |
Portion of the Total Fee |
|
Management Fees |
Salaries for stock pickers and researchers. |
The largest share (50-70%). |
|
Administrative Costs |
Server maintenance, legal compliance, support. |
The middle ground (15-30%). |
|
Distribution / 12b-1 |
Marketing ads and broker sales commissions. |
Capped at 1% in the US; completely avoidable. |
|
Miscellaneous |
Audits, custodial holding services. |
The spare change (5-10%). |
Stocks vs. Bonds: Where Fees Hurt the Most?
We usually talk about fees eating stock returns. But if you hold fixed income in your portfolio, high fees are absolutely brutal. Stocks generally return around 8% to 10% a year over long stretches. If you pay a 1.00% fee, it eats about ten percent of your profit. It hurts, but your portfolio still grows at a decent clip. You can survive it if the market has a strong bull run.
Bonds are an entirely different game. Broad bond indexes typically return closer to 4% or 5% annually. If your actively managed bond fund charges 0.60%, and the fund yields 4.5% for the year, the manager just stole a massive chunk of your total return. Since absolute bond returns are lower and steadier, finding outperformance is incredibly tough. Overcoming high fees is mathematically impossible in the long run.
This mathematical trap is exactly why cheap bond index ETFs completely dominate smart portfolios today. The average index bond ETF now charges around 0.10%. When you are fighting for yield in a fixed-income environment, every single basis point matters. Giving up half a percent in fees on a bond fund is a completely unforced error that will slowly suffocate your portfolio’s income generation.
|
Investment Type |
Historical Average Return |
If You Pay a 1.00% Fee |
The Bottom Line |
|
Stocks (Equities) |
8.00% – 10.00% |
It eats 10% to 12% of your profit. |
High growth masks the pain, but long-term drag is still severe. |
|
Bonds (Fixed Income) |
4.00% – 5.00% |
It eats 20% to 25% of your profit. |
Devastating. Lower returns mean fees take a disproportionate bite. |
Robo-Advisors and Layered Platform Fees
Investing apps and robo-advisors make life incredibly easy. I use them, and I recommend them to beginners constantly. But convenience always comes with a price tag. If you use automated platforms, you have to watch out for layered fees. A robo-advisor builds your portfolio entirely out of underlying ETFs. Those ETFs carry their own baseline expense ratios, usually around 0.05% to 0.15%.
Understanding what is expense ratio here means looking at the total picture. Because on top of that base ETF fee, the app itself charges an advisory fee. This platform fee, typically 0.25% to 0.50%, pays for the slick interface and the algorithms that handle automatic rebalancing and tax-loss harvesting. The app developers have to make their money somehow, and this is exactly how they do it.
You end up paying a fee on top of a fee. Automation is fantastic for hands-off investors, and the tax benefits sometimes cover the cost. But you have to add both numbers together so you actually know your true cost. If your robo-advisor charges 0.25% and uses ETFs that average 0.10%, your all-in cost is 0.35%. That is perfectly fine, but you need to do the math before handing over your life savings.
|
The Fee Layer |
Who Takes the Cut |
Annual Cost |
Why You Pay It |
|
Base ETF Fee |
Fund Creators (Vanguard, BlackRock) |
0.05% – 0.15% |
The raw cost of holding the actual stocks. |
|
Platform Fee |
The App (Betterment, Wealthfront) |
0.25% – 0.50% |
The cost of automation, rebalancing, and software. |
|
True Total Cost |
Combined |
0.30% – 0.65% |
What actually leaves your account every year. |
How Regulators Try to Protect You?
Governments handle fund fees very differently depending on where you live and invest. In the United States, the Securities and Exchange Commission relies heavily on sunshine and transparency. They refuse to set hard fee caps. Instead, they force funds to clearly disclose their costs in their official paperwork, assuming the free market will naturally drive prices down. Thankfully, that strategy actually worked. Driven by intense competition from low-cost providers, recent data shows the asset-weighted average fee paid by US investors dropped to an all-time low of 0.32%.
India takes a much harder line, which offers incredible protection for retail investors. The Securities and Exchange Board of India sets strict limits, called Total Expense Ratio caps, based strictly on the fund’s size. As a fund gets bigger and makes more money, regulators legally force them to lower the percentage they charge you. It is a fantastic rule that prevents massive financial institutions from overcharging everyday investors just because they have market dominance.
In Europe, the Financial Conduct Authority in the United Kingdom enforces strict Value Assessment rules. Funds have to regularly prove they offer genuinely good value for the fees they charge, or they face massive fines and public scrutiny. Whether you rely on free-market competition or strict government caps, the global trend is clear. Costs are crashing across the board, giving modern investors a massive advantage over previous generations.
|
The Regulator |
Region |
How They Handle Fees |
What It Means For You |
|
SEC |
United States |
Mandates disclosure; refuses to set hard caps. |
You have to actively shop around and compare costs yourself. |
|
SEBI |
India |
Hard TER caps based on total fund assets. |
Built-in protection. Fees drop automatically as the fund grows. |
|
FCA |
United Kingdom |
Enforces strict Value Assessment rules. |
Funds have to regularly prove they offer good value or face fines. |
Finding and Benchmarking Your Costs
Finding your exact costs takes about ten seconds of actual work. Open your brokerage app or a financial research site, type in the stock ticker symbol, and look at the main summary page. The fee percentage is always listed prominently, usually sitting right next to the dividend yield and net asset value. But once you find that number, you need to know if you are actually getting a good deal.
Here is a quick benchmarking cheat sheet based on industry averages. If you buy a broad market index fund, you should aim for 0.15% or lower. The best funds in the world charge as little as 0.03%. Anything between 0.16% and 0.50% is completely fair if you are targeting specialized sectors, dividend strategies, or international markets that cost a bit more to trade.
If you see a fee climbing over 0.75%, you need to ask some hard questions. And if it crosses 1.00%, run away. Unless that specific manager has a verified ten-year streak of completely crushing their benchmark, which is incredibly rare, you are just throwing your money away. Setting a strict fee limit on your portfolio is the easiest way to instantly improve your long-term returns.
|
The Fee Bracket |
The Verdict |
Best Fit For… |
|
0.00% – 0.15% |
Phenomenal |
Core portfolio building (broad market index ETFs). |
|
0.16% – 0.50% |
Fair enough |
International stocks, dividend funds, niche sectors. |
|
0.51% – 0.99% |
Getting pricey |
Targeted active management or specialized ESG funds. |
|
1.00%+ |
Red Alert |
Avoid completely. The math rarely works out in your favor. |
Final Thoughts
You cannot control the economy. You cannot predict the next market crash. You certainly cannot guarantee a specific dividend payout from your favorite companies. But you can ruthlessly control the fees you pay to financial institutions. By taking ten minutes to audit your portfolio, you instantly put yourself in the driver’s seat of your financial future.
Once you truly grasp what is expense ratio, you hold the ultimate advantage as a modern investor. You can instantly filter out bloated Wall Street products and build a lean, low-cost portfolio that keeps your money right where it belongs. Do not let a so-called financial expert talk you into an expensive product you do not need. The math never lies.
It might look like just a tiny fraction of a percent on your phone screen today. But over your lifetime, dodging high fees is exactly what separates retiring comfortably from retiring truly wealthy. Keep your costs incredibly low, ignore the daily market noise, and let compound interest do the heavy lifting for you.
Frequently Asked Questions (FAQs) About What is Expense Ratio
Does it include my trading commissions?
No. The expense ratio strictly covers the fund’s internal costs. If your broker charges you a flat fee every time you hit the “buy” or “sell” button, that comes out of your pocket separately.
Do I get a bill for this at the end of the year?
No. They don’t want you to see the money leave. They divide the annual fee by the number of trading days in the year and shave off a microscopic fraction from the fund’s price every single day.
Do higher fees mean I get better performance?
Absolutely not. In fact, it is the exact opposite. Morningstar’s latest 2026 data shows cost is the single most reliable predictor of a fund’s success. Cheap funds consistently beat expensive ones over the long haul.
Can the fee change after I buy the fund?
Yep. A fund’s expense ratio is not locked in stone. If a fund gets popular and takes in a flood of new cash, the fixed operating costs spread out, and the fee usually drops.