


You know how to wrangle messy numbers. You spend days buried in spreadsheets, tying out ledgers, and hunting down financial variances everyone else missed. But lately? You probably feel like you’re just reporting on the past instead of actively shaping the future of your company.
Switching from accounting to data analytics is one of the smartest career moves you can make today. Traditional accounting looks backward. It focuses heavily on compliance, audits, and manual reporting. Data analytics looks forward. It takes your hard-earned financial chops and adds the technical skills needed to predict market trends and drive real revenue.
Changing careers takes grit. It requires the kind of relentless focus and resilience you would need to run a grueling marathon. You will face tough deliveries—like debugging a stubborn SQL script or fixing a broken Tableau dashboard—but playing the long game pays off exponentially. This guide gives you the exact blueprint to make the leap. We cover the specific tools you need, how to rewrite your resume, the salary bumps you can expect, and a clear timeline to get it done.
Why Moving from Accounting to Data Analytics is a Smart Move
Accountants have a massive edge over typical analytics beginners. Most junior data analysts can write code, but they completely lack business sense. They pull thousands of rows of data without knowing what it actually means for the company’s bottom line. You already understand profit margins, operating costs, and cash flow. Learn to query databases and build visual dashboards, and you immediately become a job market unicorn: someone fluent in both business strategy and technology.
The financial upside is a huge motivator, too. The U.S. Bureau of Labor Statistics (BLS) reports that accountants hit a median pay of approximately $81,680, with a slow 5 percent job growth projected through 2034. Meanwhile, data roles are exploding across every industry. Operations research and data analysts pull a median of $91,290, and the BLS expects a massive 21 percent growth over the next decade. The big picture for 2026 shows that average data analyst salaries in the U.S. sit at roughly $84,000, with senior analysts in major metros clearing a $130,000 base pay. You basically trade a slow, highly regulated field for a fast, lucrative tech ecosystem.
|
Feature |
Traditional Accounting |
Data Analytics |
|
Core Focus |
Historical reporting, tax compliance, and auditing |
Predictive modeling, strategy, and trend forecasting |
|
Primary Tools |
Excel, QuickBooks, SAP, Oracle |
SQL, Python, Tableau, Power BI |
|
Median Salary |
Approximately $81,680 (BLS benchmarks) |
Roughly $91,290 to well over $112,000+ |
|
Market Growth |
5% expected growth (2024-2034) |
21% to 34% expected growth (2024-2034) |
|
Work Pace |
Highly cyclical (month-end close, tax season) |
Project-based, continuous delivery |
The Transferable Skills You Already Have
You are not starting from scratch, and it is crucial to recognize that before you doubt your abilities. Your finance experience translates perfectly into the tech and data world. You just need to map your current skills to their modern tech equivalents. Accountants sweat the details daily. Finding a missing comma in a massive reconciliation file requires the exact same patience as finding a syntax error in a complex programming script. You already double-check your work, audit information flows, and guarantee total accuracy.
Tech companies call this “data quality assurance,” and it takes pure computer science majors years to learn because they lack your financial discipline. Furthermore, you know how to talk to executive leadership. When you hand a profit and loss statement to a CEO, you highlight the exact numbers that matter for their strategic goals. A good data analyst does the exact same thing with an interactive dashboard, turning raw data into an actionable business story.
|
Your Accounting Skill |
The Analytics Equivalent |
Why Hiring Managers Care |
|
Financial Reporting |
KPI tracking & dashboards |
You know which metrics actually move the needle for revenue. |
|
Excel Wizardry (VLOOKUPs) |
Relational database logic |
You naturally think in tables, rows, and data relationships. |
|
Variance Analysis |
Anomaly detection |
You instantly spot when data looks wrong and investigate it. |
|
Month-End Close |
Recurring data pipelines |
You hit aggressive deadlines and manage recurring updates. |
|
Auditing & Compliance |
Data governance |
You naturally verify source integrity before publishing numbers. |
The Core Technical Skills You Need to Master
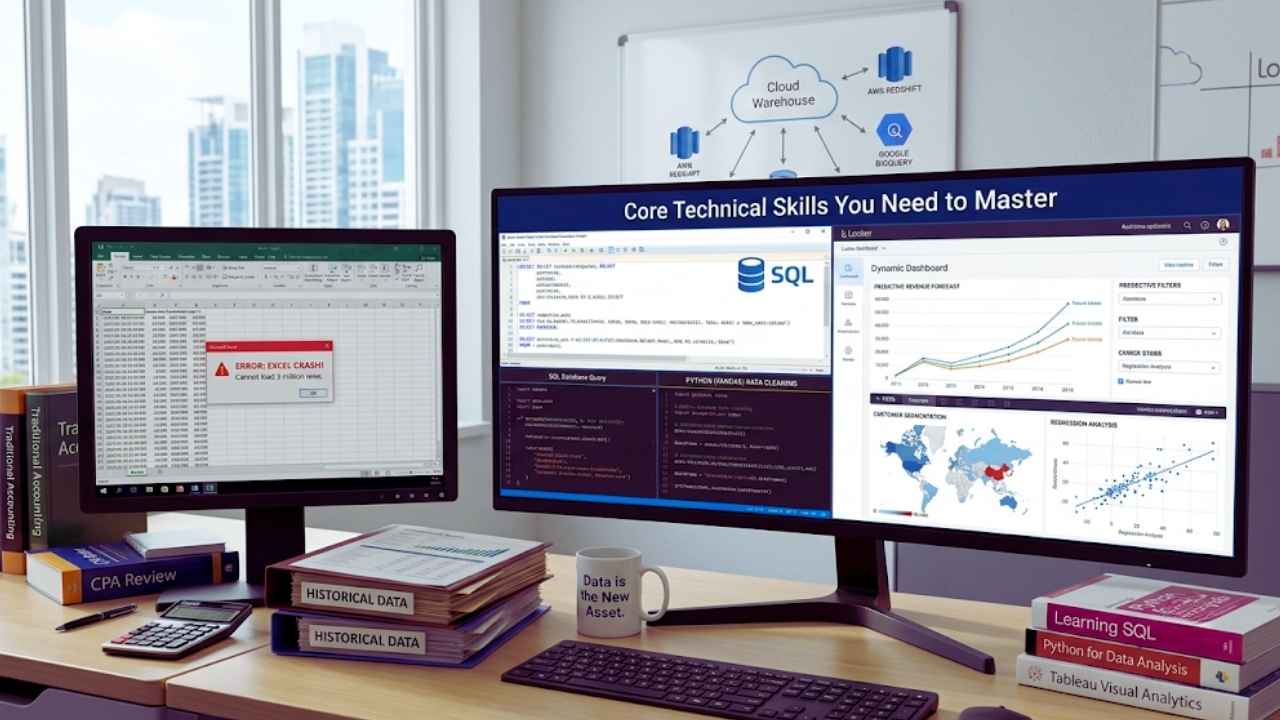 To successfully pull off the move from accounting to data analytics, you need the right tools in your arsenal. Microsoft Excel is fantastic, but it outright crashes when you load three million rows of customer transaction data. You have to learn the software and languages explicitly built for big data. This means stepping out of the standard Microsoft Office suite and diving deep into databases and scripting.
The baseline requirement for any modern analytics job is SQL, which immediately boosts your earning potential to an average of $78,000. Adding a visualization tool like Tableau or Power BI bumps that value up to $89,000, while mastering Python pushes your market rate above $104,000. You do not need to become a full-stack software developer, but you must know how to pull data from a server, clean it programmatically, and build an executive-facing dashboard that updates in real-time.
|
Skill Category |
Your Current Tool |
Your New Tool |
|
Data Storage & Retrieval |
ERP systems, localized spreadsheets |
SQL, Relational Databases, Cloud Warehouses |
|
Data Cleaning & Prep |
Manual Excel scrubbing, Power Query |
Python (Pandas library), R |
|
Reporting & Presentation |
Static financial statements, PDFs |
Tableau, Power BI, Looker Dashboards |
|
Advanced Analysis |
Historical trending, manual forecasting |
Predictive modeling, regression analysis |
SQL (Structured Query Language)
SQL is your bread and butter. It lets you talk directly to massive company databases. If your boss wants to know how many Chicago customers bought a subscription in Q3 and canceled in Q4, SQL grabs that exact answer in seconds. Since you already understand how general ledgers tie into sub-ledgers, you will pick up SQL table relationships incredibly fast. Focus on learning JOIN types, subqueries, and window functions. SQL is the absolute most requested skill in analytics. Do not skip it.
Data Visualization (Tableau or Power BI)
Accountants present data in static PDFs or dense slide decks. Analysts build dynamic, interactive dashboards. You have to learn how to tell a visual story. Power BI dominates corporate finance because it lives natively inside the Microsoft ecosystem. Tableau rules the tech startup space. Pick one and master it. Learn to build executive dashboards that let users filter by date or region without ever staring at raw, confusing numbers.
A Programming Language (Python or R)
You do not need to be a software engineer, but you do need to manipulate data with code. Python is the industry standard right now. Libraries like Pandas and NumPy make cleaning and analyzing data incredibly fast. Imagine taking five messy Excel sheets, writing a quick 10-line Python script, and instantly outputting a clean, merged dataset. Tasks that previously took you hours at month-end will now take seconds.
Your Step-by-Step Roadmap: Accounting to Data Analytics
You absolutely do not need to quit your job or take on massive student debt to execute this transition. You can build these high-value skills on nights and weekends if you stay highly disciplined. Expect this entire process to take roughly nine to twelve months of solid, part-time hustle. A common career changer path starts around a $65,000 to $80,000 entry salary, with a clear trajectory to clearly six figures by year three. The key is structured learning.
You must begin with database querying, move to visualization, tackle scripting languages, and finally consolidate everything into a public portfolio. Employers do not care about your college major as much as they care about your GitHub repository and your ability to pass a technical interview. The roadmap below breaks down exactly what you should study, when you should study it, and what your ultimate goal should be at the end of each phase.
|
Phase |
Primary Action |
Main Goal |
|
Months 1-3 |
Learn beginner SQL & BI tools. |
Write intermediate SQL queries completely from scratch. |
|
Months 4-6 |
Learn Python, focusing on Pandas. |
Clean messy datasets programmatically without opening Excel. |
|
Months 7-9 |
Build 2-3 end-to-end portfolio projects. |
Have a public web link showcasing your actual analytical work. |
|
Months 10-12 |
Network aggressively and apply. |
Land entry or mid-level interviews for hybrid roles. |
Months 1-3: Master SQL and BI Tools
Start with SQL. It is logical, structured, and easy for anyone used to complex Excel formulas. Use sites like Codecademy or DataCamp to write code right in your browser. Next, download Tableau Public or Power BI Desktop (both have free tiers). Grab free datasets online and practice turning raw numbers into clean, visually appealing charts.
Months 4-6: Tackle Python
Python takes more brainpower. Focus strictly on data manipulation—skip the web development tutorials entirely. Learn to import CSV files, clean missing values, merge massive datasets, and run basic statistics. Do not get bogged down building software apps; your only goal is data manipulation.
Months 7-9: Build a Public Portfolio
Employers do not just want certificates; they demand proof. Build a portfolio on GitHub or a personal site. Use your background to your advantage. Grab public financial datasets, clean them with Python, query them with SQL, and build a Tableau dashboard. Analyzing corporate bankruptcy trends or municipal budgets will grab a hiring manager’s attention fast.
Months 10-12: Resume Rebrand and Application Push
Stop studying and start networking. Rework your resume completely. Optimize your LinkedIn for data keywords. Apply to hybrid roles like financial analyst or business intelligence analyst first to get your foot in the door before pushing for pure data scientist titles.
How to Reframe Your Accounting Resume for Data Roles
Hiring managers will see “Staff Accountant” or “Auditor” on your resume and instantly put you in a restrictive box. You have to actively break out of that box by completely changing your professional vocabulary. Stop highlighting how many tax returns you filed or how fast you process accounts payable. Speak the exact language of data. You audit massive datasets for errors. You consolidate disparate data from multiple enterprise software systems.
You present financial insights to leadership so they can make multi-million dollar decisions. That is exactly what an analyst does every single day. Target hybrid roles like “Commercial Analyst,” “Revenue Operations Analyst,” or “Business Intelligence Analyst” first. These specific departments desperately need your deep finance background to ensure their data models actually make business sense, but they will let you use SQL and BI tools on the job to build your official technical resume.
|
Old Accounting Bullet Point |
Reframed Analytics Bullet Point |
|
Reconciled 50+ bank accounts monthly to ensure accuracy. |
Audited high-volume financial datasets, resolving thousands of data discrepancies. |
|
Created monthly financial reports for management. |
Automated monthly reporting frameworks, providing leadership with actionable revenue insights. |
|
Found a $50,000 error in a vendor invoice. |
Conducted variance analysis on expense datasets, uncovering anomalies to save $50,000. |
|
Managed the month-end close process for three subsidiaries. |
Directed recurring data aggregation pipelines across multiple units to ensure timely reporting. |
Top Certifications to Accelerate Your Journey
Skip the expensive master’s degrees unless you are pivoting into highly advanced machine learning research. The tech industry loves and respects skills-based certifications, provided you have the actual portfolio projects to back them up. Recruiters want to know you can do the job, and targeted certificates prove you have the foundational vocabulary. Start with beginner-friendly certs that cover a broad spectrum of tools, then move into specialized platforms depending on your specific career goals.
Whether you want to stay near corporate finance using the Microsoft ecosystem or dive headfirst into Python and predictive modeling, there is a certification path that fits perfectly. Grabbing one or two of these credentials validates your self-taught skills and gets your resume past the automated applicant tracking systems (ATS) that constantly block career changers.
|
Certification Name |
Primary Focus Area |
Best Suited For |
|
Google Data Analytics |
SQL, R, Tableau, basic stats |
Complete beginners wanting a broad, structured overview. |
|
Microsoft PL-300 |
Power BI, DAX, Data modeling |
Finance professionals migrating into business intelligence. |
|
IBM Data Science |
Python, Machine Learning |
Those wanting a deeper dive into coding and advanced stats. |
Final Thoughts
The jump from accounting to data analytics is a natural, highly profitable career evolution. The business world is done just recording yesterday’s news—it is obsessed with predicting tomorrow’s outcomes.
By adding SQL, Python, and data visualization to your deep financial toolkit, you become a rare, highly valuable asset. Put your head down, build real-world projects, rethink your resume vocabulary, and start building your tech foundation today. The payoff is absolutely worth the grind.
Frequently Asked Questions (FAQs) About Accounting to Data Analytics
Does my CPA license matter in data analytics?
Yes, but it depends on the industry. A consumer tech startup won’t care. But a fintech company or a massive enterprise looking for a financial data analyst? They’ll view your CPA as a massive green flag. You understand complex business logic.
Can I just use low-code tools like Alteryx instead of learning SQL?
You can, but it caps your career. Enterprise licenses for tools like Alteryx are expensive, and many companies won’t pay for them. SQL is free, universal, and expected. Learn the code.
Do I have to use financial data for my portfolio?
No. Analyze sports stats or housing markets if you want. Hiring managers care how you clean and structure the data. That said, using financial data proves you can apply complex analytics to the domain you already know best.
Am I too old to pivot into tech?
Absolutely not. The business maturity you bring from a decade in accounting is something a 22-year-old grad simply doesn’t have. You know how companies make money and how executives think. Tech companies value that highly.