


Companies track everything we do. They log what we click, what we buy, and exactly when we lose interest and close a tab. But a massive pile of raw numbers is totally useless without someone to translate it. That is where a data analyst steps in.
They take messy spreadsheets and turn them into clear insights that save businesses money and drive major decisions. Every single industry, from healthcare to sports to retail e-commerce, relies on data professionals to figure out what their customers actually want.
You do not need a heavy math background or a computer science degree to get in on this. The tech world cares about what you can actually build, not where you went to school. In fact, fewer companies demand bachelor’s degrees for these roles every single year. If you want a better career, a bigger paycheck, and remote work flexibility, you can learn data analysis online right from your couch. I am going to show you exactly how to do it. We will cover the exact skills you need, the best places to learn them, and how to build a portfolio that actually gets you hired.
Why You Should Learn Data Analysis Online Right Now
The job market for data folks is hot, and it is staying that way. Businesses are drowning in information and desperate for people who can make sense of it. The United States Bureau of Labor Statistics expects data-related roles, particularly data scientists and analysts, to explode by an incredible 34 percent by the year 2034. This is one of the fastest growth rates across all occupations globally. Companies rely on historical trends and predictive metrics to survive. When you step into this field, you position yourself in a bulletproof industry that scales upward regardless of economic downturns.
Traditional college degrees take four years and bury you in tens of thousands of dollars in debt. Online learning gives you a fast, affordable shortcut. You control the pace and skip the academic theory to focus strictly on the software employers actually ask for. Instead of writing term papers on the history of statistics, you spend your time writing code that solves real business problems. This practical approach makes you instantly valuable on day one of a new job.
The financial payoff is hard to ignore, and the barrier to entry has never been lower. Recent market data shows entry-level data analysts often start at $90,000 a year, with experienced professionals averaging a lucrative $111,000 annually. Even better, bachelor’s degree requirements for data roles dropped down to 39.4 percent in recent years, meaning portfolios beat diplomas right now. If you want to jump into a secure, high-paying career, learning from your laptop is the smartest move you can make today.
|
Benefit |
Traditional College Degree |
Self-Taught Route |
|
Timeframe |
2 to 4 years |
3 to 8 months |
|
Total Cost |
$20,000 to $80,000 or more |
$0 to $500 |
|
Focus |
Heavy on theory and history |
Heavy on practical software |
|
Schedule |
Rigid and inflexible |
Learn anytime, anywhere |
Core Skills You Must Master to Learn Data Analysis Online
Do not try to learn every shiny new tool at once. You will just burn out and quit. Data analysis relies on a very specific, tried-and-true software stack. Excel remains the undisputed backbone of global business, appearing in 41.3 percent of analyst job postings. It is not just for basic bookkeeping anymore. You must know how to clean messy data, write complex formulas, and build dynamic pivot tables. Focus heavily on mastering XLOOKUP, INDEX and MATCH functions, and conditional formatting.
SQL is your golden ticket, showing up in 53 percent of all analytics job listings across the internet. Companies do not store their real data in Excel files; they use massive relational databases that hold millions of rows of information. SQL is the language you use to talk to those servers. Focus on learning basic queries, filtering data with WHERE clauses, grouping metrics, and most importantly, mastering JOIN functions. If you can confidently join two database tables together, you are ready for a technical interview.
For visualizing numbers, Tableau appears in 28.1 percent of job postings, while Microsoft Power BI follows closely behind at 24.7 percent. Nobody wants to stare at a spreadsheet in a boardroom. You have to tell a visual story. Visualization tools let you turn boring numbers into interactive dashboards. Finally, programming languages push you ahead of the competition. Python appears in 33 percent of entry-level postings, helping you automate boring tasks and handle datasets that crash standard spreadsheets. When you set out to learn data analysis online, treat these four skills as your absolute foundation.
|
Core Skill |
Primary Tools |
Priority Level |
Real-World Application |
|
Spreadsheets |
Excel, Google Sheets |
1 (Start Here) |
Fast calculations, quick data cleaning |
|
Databases |
SQL |
2 (Must Have) |
Pulling specific records from servers |
|
Visualization |
Tableau, Power BI |
3 (Must Have) |
Building interactive manager dashboards |
|
Programming |
Python |
4 (Recommended) |
Automating workflows, handling big data |
A Step-by-Step Roadmap for Beginners
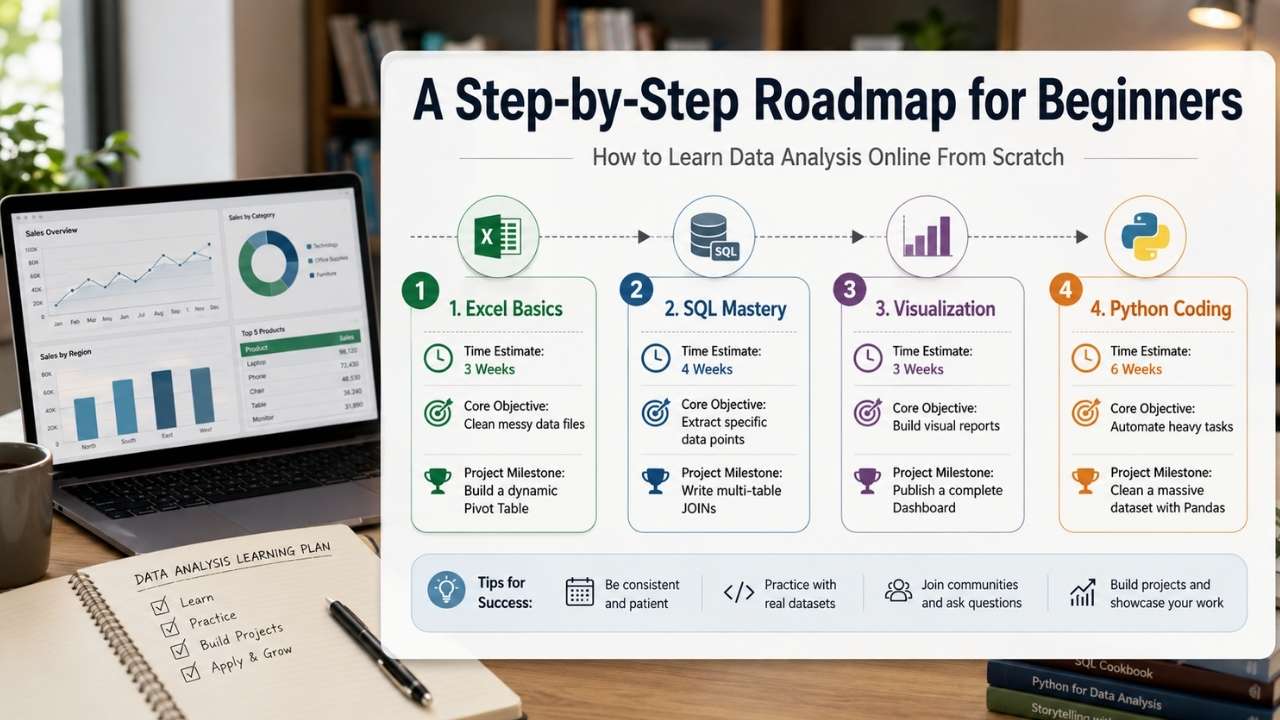
Without a solid plan, you will waste weeks watching random video tutorials that do not connect to a bigger picture. Follow this chronological roadmap to build your skills logically. Spend your first three weeks exclusively mastering Excel. Memorize keyboard shortcuts immediately to speed up your workflow. Practice handling blank cells, stripping out duplicates, and fixing broken date formats. Go find messy datasets online and force yourself to clean them up. Build at least two complex pivot tables to summarize fake retail sales data.
Next, move directly to SQL for an entire month. Download a free database management tool like PostgreSQL onto your computer. Create your own tables from scratch so you understand how data gets stored. Practice inserting fake data and pulling it back out using SELECT statements. Master the JOIN command inside and out. You need to know the exact difference between an INNER JOIN and a LEFT JOIN cold before you apply for jobs.
Then, spend three weeks on either Tableau or Power BI. Pick one; they do the exact same job. Connect your visualization tool to the SQL database you just built. Practice making clean bar charts, line graphs, and scatter plots. Learn how to use color properly. Highlight the most important numbers in red or green so your future boss can understand the chart in three seconds flat. Finally, spend six weeks tackling Python. Learn basic syntax, variables, and loops, then jump straight into the Pandas library to clean massive data files automatically.
|
Learning Phase |
Time Estimate |
Core Objective |
Project Milestone |
|
1: Excel Basics |
3 Weeks |
Clean messy data files |
Build a dynamic Pivot Table |
|
2: SQL Mastery |
4 Weeks |
Extract specific data points |
Write multi-table JOINS |
|
3: Visualization |
3 Weeks |
Build visual reports |
Publish a complete Dashboard |
|
4: Python Coding |
6 Weeks |
Automate heavy tasks |
Clean a massive dataset with Pandas |
The Best Platforms to Learn the Ropes
Skip the expensive coding bootcamps that promise the world for ten thousand dollars. You simply do not need them. The internet is packed with top-tier training materials on affordable or completely free platforms. Google offers a highly rated professional data analytics certificate on Coursera that walks you through the entire data pipeline from day one. At exactly $49 per month, most people finish in three to six months. It is incredibly structured and highly respected by recruiters for absolute beginners.
If you want hands-on coding practice right away, go to DataCamp. You write SQL and Python code directly in your web browser, bypassing the headache of installing software on your computer. The platform costs $25 per month, grades your work instantly, and points out your typos. It is the absolute fastest way to build actual muscle memory for writing syntax. You learn by doing, rather than just passively watching a screen.
Never underestimate free video resources. YouTube channels like Alex The Analyst and Luke Barousse offer complete, high-quality bootcamps for zero dollars. They show you what the day-to-day job actually looks like and walk you through building your first technical portfolio projects step-by-step. When you need raw numbers for those projects, Kaggle is your first stop. Owned by Google, this site hosts hundreds of thousands of free datasets you can download instantly to practice on.
|
Platform |
Best For |
Average Cost |
Time Commitment |
|
Coursera |
Structured certificate programs |
$49 per month |
3 to 6 months |
|
DataCamp |
Interactive, browser-based coding |
$25 per month |
Flexible |
|
YouTube |
Free project walkthroughs |
Free |
Self-paced |
|
Kaggle |
Accessing real-world datasets |
Free |
On-demand |
The Soft Skills Nobody Talks About
Technical software skills get you the interview, but your soft skills actually get you hired. Companies do not want a human calculator; they want a problem solver. You will constantly deal with missing data, broken code, and vague requests from managers who do not really know what they want. You have to figure out how to unblock yourself without giving up. Resilience and a strong mindset for troubleshooting are just as important as writing a perfect block of code.
You also have to explain complex statistics to marketing or sales directors who do not know what a SQL join is. Keep your explanations incredibly simple. Clear communication wins every single time. If you build the most advanced machine learning model in the world but cannot explain how it makes the company money, nobody will care. You have to act as the bridge between raw server data and everyday business strategy.
Furthermore, you need solid business acumen. You need to know how the company actually generates profit. If you analyze e-commerce data, you better understand profit margins, customer acquisition costs, and basic supply chain metrics. An analyst who knows how to tie raw data directly to company revenue is incredibly rare and highly valued. Do not ignore your communication skills while buried in code; practice explaining your findings out loud.
|
Soft Skill |
Why It Matters |
How to Showcase It |
|
Problem Solving |
Fixes broken code and messy files |
Walk through your logic in interviews |
|
Communication |
Translates numbers for executives |
Write clear summaries for your projects |
|
Business Acumen |
Connects data to company profits |
Ask business-focused questions |
How to Build a Standout Data Portfolio
Certificates just prove you watched a video and passed a multiple-choice quiz. A portfolio proves you can actually do the work. When you choose to learn data analysis online, your portfolio becomes your real resume. Avoid the overused beginner datasets. Every hiring manager has seen the Titanic passenger survival dataset a thousand times. Pick a topic you actually care about. Look at local housing prices, sports statistics, or your own music listening habits to stand out from the crowd.
Do not just make a random chart to show you know how to click buttons. Start with a real business question. Grab a messy dataset of company expenses, clean it up, fix the dates, and build an Excel pivot table showing exactly where the budget went. Next, find a customer database and write SQL queries to figure out why specific demographics cancel their subscriptions. Build a Power BI dashboard showing total revenue and regional heat maps to tie it all together into a story.
You need a professional place to display this work. Sign up for a free GitHub account to host your SQL and Python scripts. Use Tableau Public to host your interactive dashboards for free on the web. Create a simple Notion page or a free Carrd website to link everything together in one neat package. When a recruiter asks for your experience, you just hand them one link that proves your capability instantly.
|
Project Type |
Tools Used |
Business Question Answered |
What It Shows Employers |
|
Expense Report |
Excel |
Where is the company spending the most? |
Attention to detail |
|
Churn Analysis |
SQL |
Why are customers leaving our service? |
Database querying logic |
|
Sales Dashboard |
Power BI |
What products drive our highest revenue? |
Visual communication |
Landing Your First Entry-Level Data Analyst Job
You learned the tools and built the portfolio. Now you need to beat the automated human resources bots and get a real human on the phone. Ditch the fancy, colorful resume templates that confuse applicant tracking systems. Keep it to one simple column with black text. Put your technical software skills right at the top. Under your experience section, focus heavily on the portfolio projects you built. Use hard numbers. Do not just say you used SQL to clean data. Say you cleaned a 50,000-row sales dataset using SQL to spot a 15 percent drop in quarterly revenue.
Spamming job boards with quick applications usually leads straight to a black hole. Go directly to LinkedIn. Look up people with the title of Data Analyst at companies you like. Send a brief message asking about their day-to-day work or asking for quick feedback on your portfolio. Do not ask for a job on day one. Build the relationship first, because employee referrals are the absolute easiest way in the door.
When you finally land the interview, prepare for a technical test. Expect a live screen-share where you have to write SQL on the spot. Talk through your thought process out loud. Even if you get nervous and write the wrong code, showing them a logical, calm approach to problem-solving can still get you hired. Employers want to see how you think when things break, not just how well you memorized syntax.
|
Job Search Strategy |
Action Item |
Expected Result |
|
Resume Formatting |
Add portfolio links, list exact tools |
Pass automated HR screeners |
|
Cold Outreach |
Message 5 working analysts a week |
Warm connections and referrals |
|
Interview Prep |
Practice LeetCode SQL questions |
Pass the live technical exam |
Final Thoughts
Breaking into the tech industry takes grit, but the entire roadmap is free and open to the public. You just have to sit down and actually do the work. Be ruthless about focusing on the core stack of Excel, SQL, and a visualization tool. Build unique projects that you actually find interesting and solve real business problems. You will hit roadblocks, write broken code, and feel totally overwhelmed at times, but pushing through that frustration is exactly how you build the problem-solving skills employers pay top dollar for.
If you stay consistent, stick to a strict learning schedule, and network smartly on LinkedIn, you can absolutely learn data analysis online and pivot into a high-paying, flexible career in a matter of months. Do not wait for the perfect time to begin. The resources are sitting right in front of you. Start small today. Grab a free dataset, open up a spreadsheet, and get your hands dirty.
Frequently Asked Questions (FAQs) About Learn Data Analysis Online
Will AI take my job?
No. AI tools are great at writing boilerplate code, but they completely lack business context. AI doesn’t know why your company’s marketing campaign failed last week. AI is just a tool you’ll use to work faster.
Do I need an advanced degree?
No. The tech market is leaning heavily into skills-based hiring. Bachelor’s degree requirements for data roles drop every year. Your portfolio matters way more than a piece of paper.
Do I need to be a math genius?
No. You need basic arithmetic and a solid grasp of percentages, averages, and medians. The software handles the heavy math for you. Logic and critical thinking beat advanced calculus every time.
Can I use a Mac to learn?
Mostly, yes. Excel, SQL, Tableau, and Python work perfectly on a Mac. The only catch is Microsoft Power BI, which only runs properly on Windows. If a job specifically demands Power BI, you’ll need to run a virtual Windows machine on your Mac.